
Chin J Plant Ecol ›› 2010, Vol. 34 ›› Issue (3): 348-358.DOI: 10.3773/j.issn.1005-264x.2010.03.012 cstr: 32100.14.j.issn.1005-264x.2010.03.012
Special Issue: 青藏高原植物生态学:种群生态学
• Research Articles • Previous Articles
ZHU Zhi-Hong1,*( ), XI Bo1, LI Ying-Nian2, ZANG Yue-Ming1, WANG Wen-Juan1, LIU Jian-Xiu1, GUO Hua1
Received:2009-02-17
Accepted:2009-08-12
Online:2010-02-17
Published:2010-03-01
Contact:
ZHU Zhi-Hong
ZHU Zhi-Hong, XI Bo, LI Ying-Nian, ZANG Yue-Ming, WANG Wen-Juan, LIU Jian-Xiu, GUO Hua. Compensatory growth of Carex scabrirostris in different habitats in alpine meadow[J]. Chin J Plant Ecol, 2010, 34(3): 348-358.
| 时间 Time | 生境特性 Habitat characteristics | F(2,6) | 生境 Habitat | ||
|---|---|---|---|---|---|
| I | II | III | |||
| 6月 Jun. | pH值 pH value 土壤含水量 Soil water content (SWC, %) 有机质 Organic matter (OM, g·kg-1) 全氮 Total nitrogen (TN, g·kg-1) 硝态氮 Nitrate nitrogen (NN, mg·kg-1) 氨态氮 Ammoniacal nitrogen (AN, mg·kg-1) 全磷 Total phosphorus (TP, g·kg-1) 速效磷 Available phosphorus (AP, mg·kg-1) 地上重 Aboveground mass (AM, g·ramet-1) 群落采食率 Defoliation ratio (DR, %) 粗喙薹草采食率 DR of Carex scabrirostris (%) | 1.22ns 22.87** 6.18* 11.06** 18.25** 2.42ns 4.17† 7.05* 4.12† 19.17** 11.76** | 7.75 ± 0.11a 26.66 ± 1.27b 148.23 ± 32.89b 8.09 ± 1.26ab 67.29 ± 31.45b 46.75 ± 7.69a 1.13 ± 0.08b 11.97 ± 3.91b 0.18 ± 0.03b 43.65 ± 11.81c 32.79 ± 9.62c | 7.93 ± 0.13a 21.89 ± 0.82a 82.66 ± 8.94a 5.48 ± 0.51a 11.03 ± 2.58a 48.95 ± 13.14a 0.89 ± 0.09a 3.36 ± 0.81a 0.13 ± 0.04ab 32.17 ± 5.23b 14.47 ± 3.91b | 7.78 ± 0.18a 22.82 ± 0.44a 102.15 ± 26.63ab 11.31 ± 2.66b 22.71 ± 7.21a 60.00 ± 16.02a 0.92 ± 0.11ab 4.32 ± 2.97a 0.10 ± 0.03a 10.35 ± 2.89a 9.26 ± 0.86a |
| 8月 Aug. | pH值 pH value 土壤含水量 Soil water content (SWC, %) 有机质 Organic matter (OM, g·kg-1) 全氮 Total nitrogen (TN, g·kg-1) 硝态氮 Nitrate nitrogen (NN, mg·kg-1) 氨态氮 Ammoniacal nitrogen (AN, mg·kg-1) 全磷 Total phosphorus (TP, g·kg-1) 速效磷 Available phosphorus (AP, mg·kg-1) 群落盖度 Community coverage (TC, %) | 1.69ns 22.85** 11.21** 15.14** 4.48† 6.33* 30.57** 4.65† 14.35** | 7.74 ± 0.09a 29.61 ± 1.93b 173.60 ± 52.59b 13.71 ± 2.00b 27.36 ± 18.61b 43.08 ± 10.39b 1.32 ± 0.11b 14.32 ± 10.26b 99.56 ± 0.51b | 7.89 ± 0.26a 23.63 ± 1.41a 81.01 ± 5.47a 9.61 ± 2.26b 4.63 ± 3.37a 21.74 ± 2.11a 0.88 ± 0.02a 3.38 ± 1.22a 96.33 ± 2.73b | 8.05 ± 0.21a 25.63 ± 0.58a 91.27 ± 17.11a 5.64 ± 1.15a 2.76 ± 2.08a 31.48 ± 9.15ab 0.93 ± 0.07a 3.64 ± 2.26a 80.78 ± 8.04a |
Table 1 Comparison of nutrient and water content in the soil, defoliation ratio of herbs and coverage of communities among habitats
| 时间 Time | 生境特性 Habitat characteristics | F(2,6) | 生境 Habitat | ||
|---|---|---|---|---|---|
| I | II | III | |||
| 6月 Jun. | pH值 pH value 土壤含水量 Soil water content (SWC, %) 有机质 Organic matter (OM, g·kg-1) 全氮 Total nitrogen (TN, g·kg-1) 硝态氮 Nitrate nitrogen (NN, mg·kg-1) 氨态氮 Ammoniacal nitrogen (AN, mg·kg-1) 全磷 Total phosphorus (TP, g·kg-1) 速效磷 Available phosphorus (AP, mg·kg-1) 地上重 Aboveground mass (AM, g·ramet-1) 群落采食率 Defoliation ratio (DR, %) 粗喙薹草采食率 DR of Carex scabrirostris (%) | 1.22ns 22.87** 6.18* 11.06** 18.25** 2.42ns 4.17† 7.05* 4.12† 19.17** 11.76** | 7.75 ± 0.11a 26.66 ± 1.27b 148.23 ± 32.89b 8.09 ± 1.26ab 67.29 ± 31.45b 46.75 ± 7.69a 1.13 ± 0.08b 11.97 ± 3.91b 0.18 ± 0.03b 43.65 ± 11.81c 32.79 ± 9.62c | 7.93 ± 0.13a 21.89 ± 0.82a 82.66 ± 8.94a 5.48 ± 0.51a 11.03 ± 2.58a 48.95 ± 13.14a 0.89 ± 0.09a 3.36 ± 0.81a 0.13 ± 0.04ab 32.17 ± 5.23b 14.47 ± 3.91b | 7.78 ± 0.18a 22.82 ± 0.44a 102.15 ± 26.63ab 11.31 ± 2.66b 22.71 ± 7.21a 60.00 ± 16.02a 0.92 ± 0.11ab 4.32 ± 2.97a 0.10 ± 0.03a 10.35 ± 2.89a 9.26 ± 0.86a |
| 8月 Aug. | pH值 pH value 土壤含水量 Soil water content (SWC, %) 有机质 Organic matter (OM, g·kg-1) 全氮 Total nitrogen (TN, g·kg-1) 硝态氮 Nitrate nitrogen (NN, mg·kg-1) 氨态氮 Ammoniacal nitrogen (AN, mg·kg-1) 全磷 Total phosphorus (TP, g·kg-1) 速效磷 Available phosphorus (AP, mg·kg-1) 群落盖度 Community coverage (TC, %) | 1.69ns 22.85** 11.21** 15.14** 4.48† 6.33* 30.57** 4.65† 14.35** | 7.74 ± 0.09a 29.61 ± 1.93b 173.60 ± 52.59b 13.71 ± 2.00b 27.36 ± 18.61b 43.08 ± 10.39b 1.32 ± 0.11b 14.32 ± 10.26b 99.56 ± 0.51b | 7.89 ± 0.26a 23.63 ± 1.41a 81.01 ± 5.47a 9.61 ± 2.26b 4.63 ± 3.37a 21.74 ± 2.11a 0.88 ± 0.02a 3.38 ± 1.22a 96.33 ± 2.73b | 8.05 ± 0.21a 25.63 ± 0.58a 91.27 ± 17.11a 5.64 ± 1.15a 2.76 ± 2.08a 31.48 ± 9.15ab 0.93 ± 0.07a 3.64 ± 2.26a 80.78 ± 8.04a |
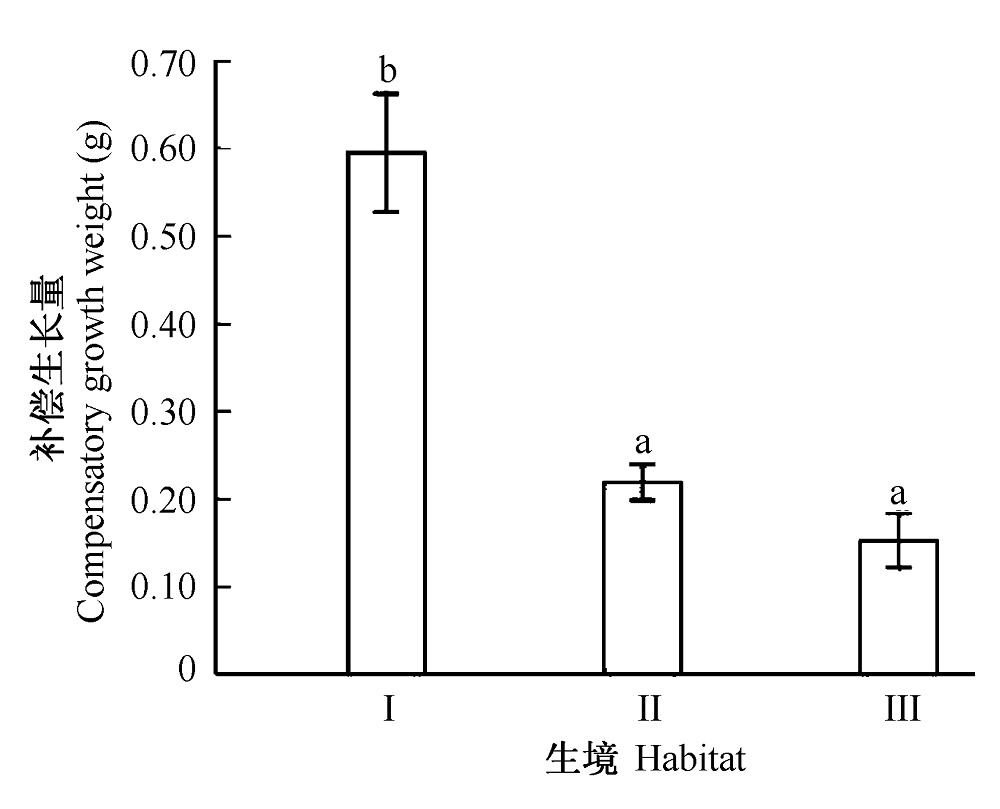
Fig. 1 Compensatory growth weight of Carex scabrirostris ramet in different habitats in Haibei alpine meadow (mean ± SE). I, II and III in the figure indicate pen, pass and ungrazed pasture habitats, respectively. Different letters above error bars indicate significant differences (p < 0.05) among habitats.
| 生境内补偿指数G/C1 Compensatory index G/C1 within habitats | 生境间补偿指数G/C2 Compensatory index G/C2 among habitats | ||||
|---|---|---|---|---|---|
| Ⅰ | Ⅱ | Ⅲ | Ⅰ | Ⅱ | Ⅲ |
| 1.119 ± 0.137 | 1.169 ± 0.073 | 0.982 ± 0.007 | 6.385 ± 1.223 | 2.316 ± 0.061 | 0.982 ± 0.007 |
Table 2 Compensatory index G/C of Carex scabrirostris ramet in different habitats (mean ± SE)
| 生境内补偿指数G/C1 Compensatory index G/C1 within habitats | 生境间补偿指数G/C2 Compensatory index G/C2 among habitats | ||||
|---|---|---|---|---|---|
| Ⅰ | Ⅱ | Ⅲ | Ⅰ | Ⅱ | Ⅲ |
| 1.119 ± 0.137 | 1.169 ± 0.073 | 0.982 ± 0.007 | 6.385 ± 1.223 | 2.316 ± 0.061 | 0.982 ± 0.007 |
| 生物量分配 Biomass allocation (%) | F(2,6) | 生境 Habitat | ||
|---|---|---|---|---|
| I | II | III | ||
| 生长分配 Growth allocation, GA 有性繁殖分配 Sexual reproductive allocation, SRA 储藏分配 Storage allocation, SA 克隆繁殖分配 Clonal propagation allocation, CPA 地上生物量分配 Aboveground biomass allocation, AA 地下生物量分配 Belowground biomass allocation, BA | 4.81 † 1.19ns 19.35** 2.36ns 4.48 † 5.19 * | 37.91 ± 3.35b 0.16 ± 0.02a 17.80 ± 1.34a 44.13 ± 2.34a 37.91 ± 3.34b 62.09 ± 3.34a | 22.64 ± 2.16a 0.77 ± 0.71a 38.15 ± 2.34c 38.44 ± 1.70a 23.40 ± 1.86a 76.60 ± 1.86b | 35.62 ± 2.43b 0.34 ± 0.14a 29.07 ± 3.15b 34.97 ± 2.97a 35.94 ± 2.43ab 64.06 ± 2.43a |
Table 3 Biomass allocation of Carex scabrirostris ramet in different habitats in Haibei alpine meadow (mean ± SE)
| 生物量分配 Biomass allocation (%) | F(2,6) | 生境 Habitat | ||
|---|---|---|---|---|
| I | II | III | ||
| 生长分配 Growth allocation, GA 有性繁殖分配 Sexual reproductive allocation, SRA 储藏分配 Storage allocation, SA 克隆繁殖分配 Clonal propagation allocation, CPA 地上生物量分配 Aboveground biomass allocation, AA 地下生物量分配 Belowground biomass allocation, BA | 4.81 † 1.19ns 19.35** 2.36ns 4.48 † 5.19 * | 37.91 ± 3.35b 0.16 ± 0.02a 17.80 ± 1.34a 44.13 ± 2.34a 37.91 ± 3.34b 62.09 ± 3.34a | 22.64 ± 2.16a 0.77 ± 0.71a 38.15 ± 2.34c 38.44 ± 1.70a 23.40 ± 1.86a 76.60 ± 1.86b | 35.62 ± 2.43b 0.34 ± 0.14a 29.07 ± 3.15b 34.97 ± 2.97a 35.94 ± 2.43ab 64.06 ± 2.43a |
| 生长分配 GA (%) | 有性繁殖分配 SRA (%) | 储藏分配 SA (%) | 克隆繁殖分配 CPA (%) | 地上生物量分配 AA (%) | 地下生物量分配 BA (%) | 生境间补偿指数 G/C2 | |
|---|---|---|---|---|---|---|---|
| 生长分配 GA (%) 有性繁殖分配 SRA (%) 储藏分配 SA (%) 克隆繁殖分配 CPA (%) 地上生物量分配 AA (%) 地下生物量分配 BA (%) 生境间补偿指数 G/C2 补偿生长量 CDW (g) | -0.448* -0.736** -0.226 0.998** -0.998** 0.305 0.335 | 0.471* -0.163 -0.431** 0.431** -0.139 -0.053 | -0.435* -0.733** 0.733** -0.507** -0.470** | -0.234 0.234 0.259 0.177 | -1.000** 0.320 0.367 | -0.320 -0.367 | 0.732** |
Table 4 Spearman correlation for biomass allocation and compensatory growth of Carex scabrirostris ramet in Haibei alpine meadow
| 生长分配 GA (%) | 有性繁殖分配 SRA (%) | 储藏分配 SA (%) | 克隆繁殖分配 CPA (%) | 地上生物量分配 AA (%) | 地下生物量分配 BA (%) | 生境间补偿指数 G/C2 | |
|---|---|---|---|---|---|---|---|
| 生长分配 GA (%) 有性繁殖分配 SRA (%) 储藏分配 SA (%) 克隆繁殖分配 CPA (%) 地上生物量分配 AA (%) 地下生物量分配 BA (%) 生境间补偿指数 G/C2 补偿生长量 CDW (g) | -0.448* -0.736** -0.226 0.998** -0.998** 0.305 0.335 | 0.471* -0.163 -0.431** 0.431** -0.139 -0.053 | -0.435* -0.733** 0.733** -0.507** -0.470** | -0.234 0.234 0.259 0.177 | -1.000** 0.320 0.367 | -0.320 -0.367 | 0.732** |
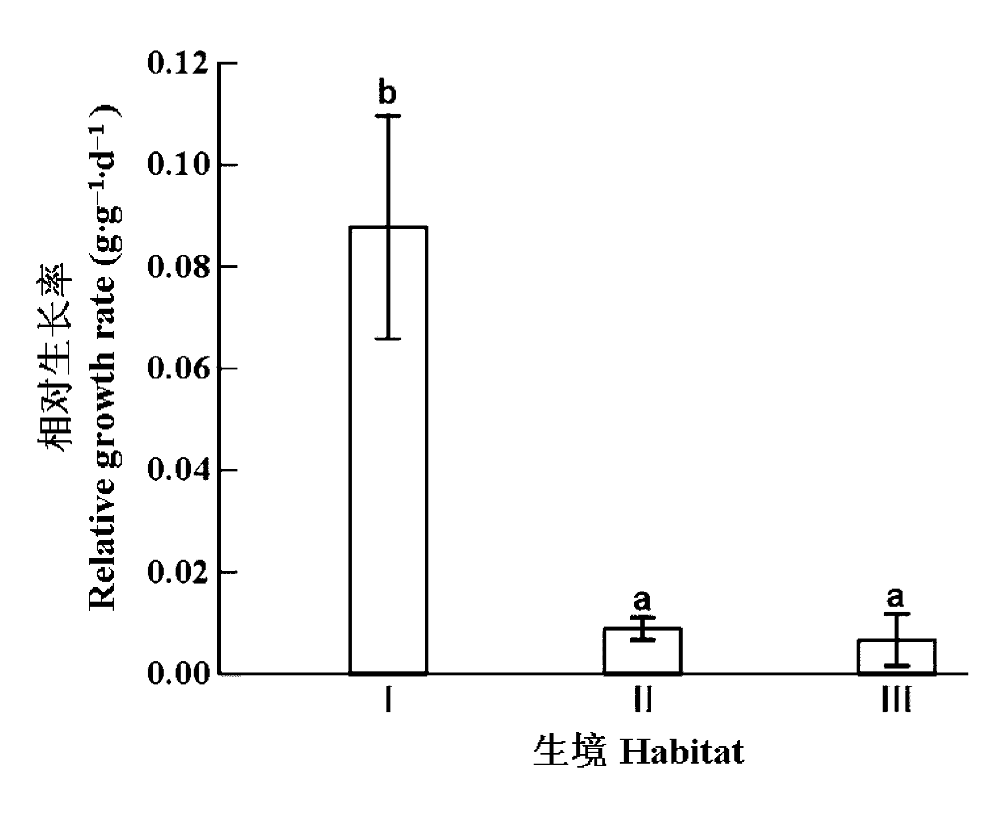
Fig. 2 Relative growth rate of Carex scabrirostris ramet after defoliating in different habitats in Haibei alpine meadow (mean ± SE). I, II and III indicate pen, pass and ungrazed pasture habitats, respectively. Different letters above error bars indicate significant differences (p < 0.05) among habitats.
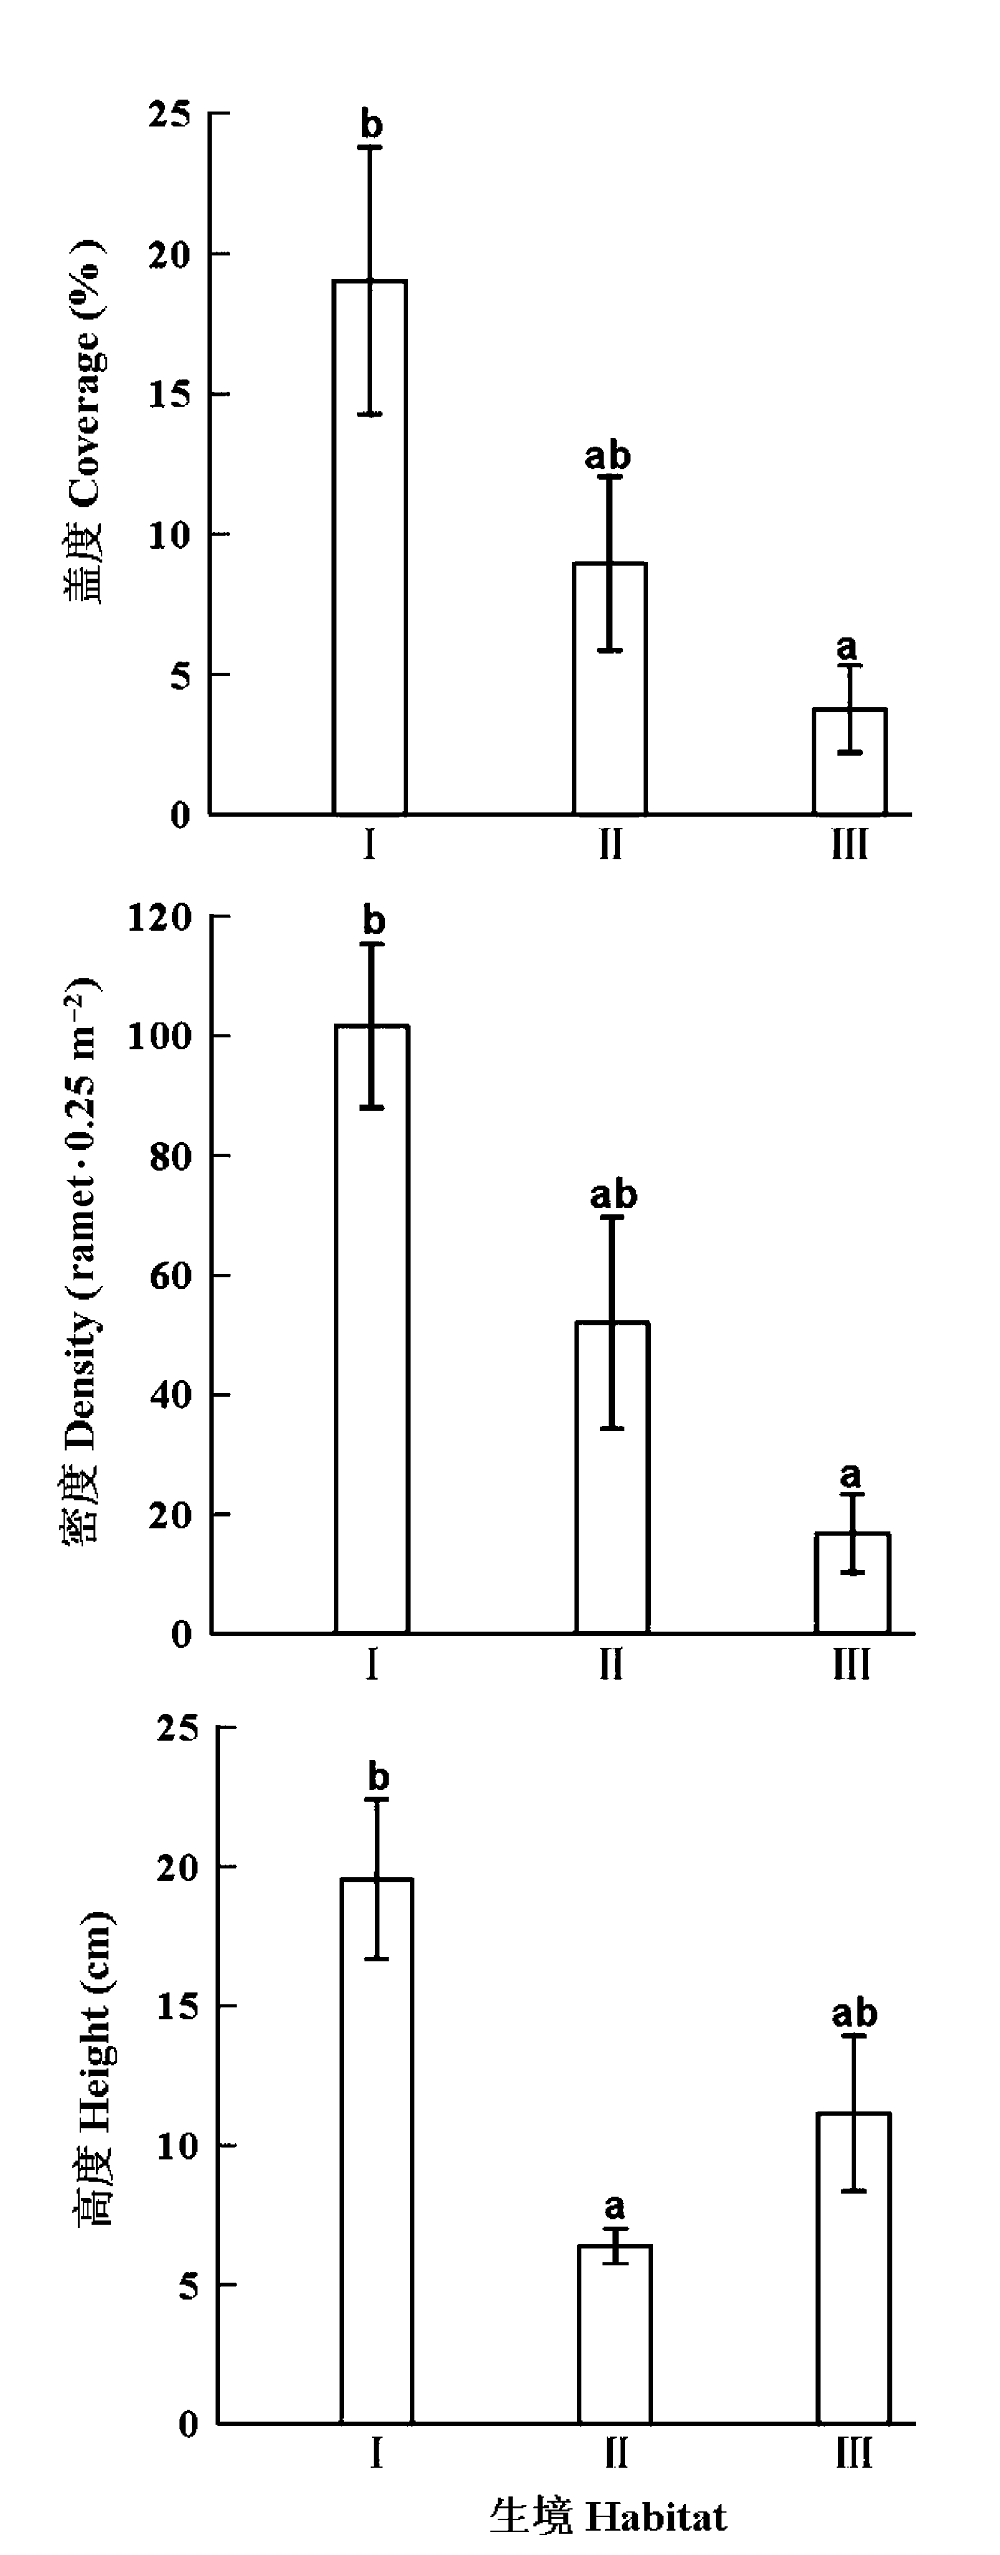
Fig. 3 Varieties of coverage, density and plant height of Carex scabrirostris ramet population in different habitats in Haibei alpine meadow (mean ± SE). I, II and III indicate pen, pass and ungrazed pasture habitats, respectively. Different letters above error bars indicate significant differences (p < 0.05) among habitats.
| 排序轴 Axes | 特征值 Eigen- values | 累计方差 Cumulative percentage variance (%) | 6月 June | 8月 August | RGR | DR | ||||||||||||||
|---|---|---|---|---|---|---|---|---|---|---|---|---|---|---|---|---|---|---|---|---|
| pH | SWC | OM | TN | NN | AN | TP | AP | pH | SWC | OM | TN | NN | AN | TP | AP | |||||
| 1 | 0.024 | 60.3 | 0.09 | -0.20 | 0.40* | 0.42* | -0.30 | 0.37* | -0.58** | -0.39* | -0.16 | -0.60** | -0.59** | |||||||
| 2 | 0.005 | 73.1 | -0.37* | 0.73** | 0.31 | 0.52** | 0.46* | -0.04 | 0.25 | 0.26 | 0.82** | 0.55** | 0.17 | |||||||
| 3 | 0.001 | 75.7 | -0.04 | -0.12 | -0.01 | 0.12 | -0.17 | 0.03 | -0.15 | 0.08 | -0.04 | -0.07 | -0.31 | |||||||
| 4 | 0.001 | 77.5 | -0.09 | 0.10 | -0.09 | 0.08 | 0.15 | -0.09 | -0.03 | -0.06 | -0.07 | -0.01 | 0.03 | |||||||
| Monte Carlo检验p值 Monte Carlo test’ p value | 0.06† | ﹟ | 0.53 | 0.28 | ﹟ | 0.01** | 0.06† | ﹟ | 0.30 | ﹟ | ﹟ | 0.38 | 0.27 | 0.04* | ﹟ | ﹟ | 0.01** | 0.26 | ||
Table 5 Forward selection and Monte Carlo test for the impact factors and the correlation coefficients between CCA ordination axes and impact factors
| 排序轴 Axes | 特征值 Eigen- values | 累计方差 Cumulative percentage variance (%) | 6月 June | 8月 August | RGR | DR | ||||||||||||||
|---|---|---|---|---|---|---|---|---|---|---|---|---|---|---|---|---|---|---|---|---|
| pH | SWC | OM | TN | NN | AN | TP | AP | pH | SWC | OM | TN | NN | AN | TP | AP | |||||
| 1 | 0.024 | 60.3 | 0.09 | -0.20 | 0.40* | 0.42* | -0.30 | 0.37* | -0.58** | -0.39* | -0.16 | -0.60** | -0.59** | |||||||
| 2 | 0.005 | 73.1 | -0.37* | 0.73** | 0.31 | 0.52** | 0.46* | -0.04 | 0.25 | 0.26 | 0.82** | 0.55** | 0.17 | |||||||
| 3 | 0.001 | 75.7 | -0.04 | -0.12 | -0.01 | 0.12 | -0.17 | 0.03 | -0.15 | 0.08 | -0.04 | -0.07 | -0.31 | |||||||
| 4 | 0.001 | 77.5 | -0.09 | 0.10 | -0.09 | 0.08 | 0.15 | -0.09 | -0.03 | -0.06 | -0.07 | -0.01 | 0.03 | |||||||
| Monte Carlo检验p值 Monte Carlo test’ p value | 0.06† | ﹟ | 0.53 | 0.28 | ﹟ | 0.01** | 0.06† | ﹟ | 0.30 | ﹟ | ﹟ | 0.38 | 0.27 | 0.04* | ﹟ | ﹟ | 0.01** | 0.26 | ||
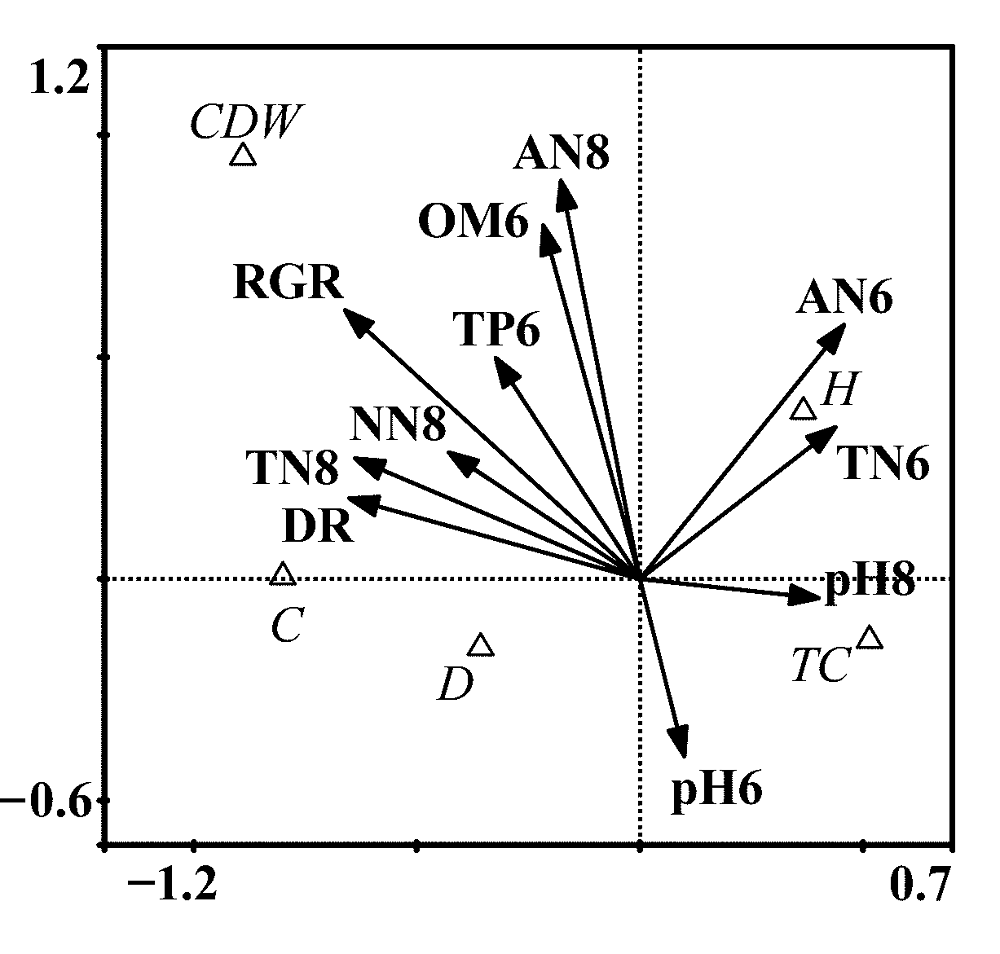
Fig. 4 The ordination diagram of CCA with environmental variables selected by the forward selection procedure for the compensatory growth of Carex scabrirostris ramet. Arabic numbers in the ordination diagram indicate the sampling month. OM, organic matter (g·kg-1); TN, total nitrogen (g·kg-1); NN, nitrate nitrogen (mg·kg-1); AN, ammoniacal nitrogen (mg·kg-1); TP, total phosphorus (g·kg-1); RGR, relative growth ratio (g·g-1·d-1); DR, defoliation ratio (%); CDW, compensatory growth weight (g); TC, total coverage (%); C, coverage of Carex scabrirostris (%); D, density of C. scabrirostris (0.25 m2); H, height of Carex scabrirostris (cm).
| [1] |
Alward RD, Joern A (1993). Plasticity and overcompensation in grass responses to herbivory. Oecologia, 95, 358-364.
URL PMID |
| [2] | An Y (安渊), Li B (李博), Yang C (杨持), Xu Z (徐柱), Yan ZJ (阎志坚), Han GD (韩国栋) (2001). Plant compensatory growth and grassland sustainable use. Grassland of China (中国草地), 23(6), 1-5. (in Chinese with English abstract) |
| [3] |
Belsky AJ (1986). Does herbivory benefit plants? A review of the evidence. The American Naturalist, 127, 870-892.
DOI URL |
| [4] | Bråthen KA, Odasz-Albrigtsen AM (2000). Tolerance of the arctic graminoid Luzual arcuata ssp. confusa to simulated grazing in two nitrogen environments. Canadian Journal of Botany, 78, 1108-1113. |
| [5] | Briske DD (1996). Strategies of plant survival in grazed systems: a functional interpretation. In: Hodgson J ed. The Ecology and Management of Grazing Systems. Oxford University Press, New York, 37-67. |
| [6] | Crawley MJ (1997). Plant-herbivory dynamics. In: Crawley MJ ed. Plant Ecology Black Science, Oxford. 401-474. |
| [7] |
Damhoureyeh SA, Hartnett DC (2002). Variation in grazing tolerance among three tallgrass prairie plant species. American Journal of Botany, 89, 1634-1643.
DOI URL PMID |
| [8] |
Dyer MI, Turner CL, Seastedt TR (1993). Herbivory and its consequences. Ecological Applications, 3, 10-16.
URL PMID |
| [9] |
Erneberg M (1999). Effects of herbivory and competition on an introduced plant in decline. Oecologia, 118, 203-209.
DOI URL PMID |
| [10] |
Gao Y, Wang DL, Ba L, Bai YG, Liu B (2008). Interactions between herbivory and resource availability on grazing tolerance of Leymus chinensis. Environmental and Experimental Botany, 63, 113-122.
DOI URL |
| [11] | Grime JP, Crick JC, Rincon JE (1986). The ecological significance of plasticity. In: Jennings DH, Trewavas AJ eds. Plasticity in Plants Biologists Limited, Cambridge. 5-29. |
| [12] | Han GD (韩国栋), Li B (李博), Wei ZJ (卫智军), Yang J (杨静), Lü X (吕雄), Li H (李宏) (1999). Plant compensatory growth in the grazing system of Stipa breviflora desert steppe. I. Plant net productivity. Acta Agrestia Sinica (草地学报), 7(3), 1-7. (in Chinese with English abstract) |
| [13] |
Hawkes CV, Sullivan JJ (2001). The impact of herbivory on plants in different resource conditions: a meta-analysis. Ecology, 82, 2045-2058.
DOI URL |
| [14] |
Hilbert DW, Swift DM, Detling JK, Dyer MI (1981). Relative growth rates and the grazing optimization hypothesis. Oecologia, 51, 14-18.
DOI URL PMID |
| [15] |
Hochwender CG, Marquis RJ, Stowe KA (2000). The potential for and constraints on the evolution of compensatory ability in Asclepias syriaca. Oecologia, 122, 361-370.
DOI URL PMID |
| [16] |
Huhta AP, Hellström K, Rautio P, Tuomi J (2000). A test of the compensatory continuum: fertilization increases and below-ground competition decreases the grazing tolerance of tall wormseed mustard ( Erysimum strictum). Evolutionary Ecology, 14, 353-372.
DOI URL |
| [17] |
Jaramillo VJ, Detling JK (1998). Grazing history, defoliation, and competition: effects on shortgrass production and nitrogen accumulation. Ecology, 69, 1599-1608.
DOI URL |
| [18] |
Leriche K, Le Roux X, Desnoyers F, Benest D, Simioni G, Abbadie L (2003). Grass response to clipping in an African savanna: testing the grazing optimization hypothesis. Ecological Applications, 13, 1346-1354.
DOI URL |
| [19] | Li YN (李英年), Zhao XQ (赵新全), Cao GM (曹广民), Zhao L (赵亮), Wang QX (王勤学)(2004). Analyses on climates and vegetation productivity backgroundat Haibei Alpine Meadow Ecosystem Research Station. Plateau `Meteorology (高原气象), 23, 558-567. (in Chinese with English abstract) |
| [20] | Liu Y (刘艳), Wei ZJ (卫智军), Yang J (杨静), Yang SM (杨尚明) (2004). Plant compensatory growth under different grazing system in Stipa breviflore desert steppe. Grassland of China (中国草地), 26(3), 18-23. (in Chinese with English abstract) |
| [21] | Liu Y (刘颖), Wang DL (王德利), Han SJ (韩士杰), Wang X (王旭) (2004). Effect of grazing intensity on the regrowth capability in Leymus chinensis grassland. Acta Prataculturae Sinica (草业学报), 13(6), 39-44. (in Chinese with English abstract) |
| [22] |
Maschinski J, Whitham TG (1989). The continuum of plant responses to herbivory: the influence of plant association, nutrient availability and timing. The American Naturalist, 134, 1-19.
DOI URL |
| [23] |
McIntire EJB, Hik DS (2005). Influences of chronic and current season grazing by collared pikas on above-ground biomass and species richness in subarctic alpine meadows. Oecologia, 145, 288-297.
DOI URL PMID |
| [24] |
McNaughton SJ (1979). Grazing as an optimization process: grass-ungulate relationship in the Serengeti. The American Naturalist, 113, 691-703.
DOI URL |
| [25] |
Paige KN (1999). Regrowth following ungulate herbivory in Ipomopsis aggregata: geographic evidence for overcompensation. Oecologia, 118, 316-323.
URL PMID |
| [26] | Shan BQ (单保庆), Du GZ (杜国祯), Liu ZH (刘振恒) (2000). Clonal growth of Ligularia virgaurea: morphological responses to nutritional variation. Acta Phytoecologica Sinica (植物生态学报), 24, 46-51. (in Chinese with English abstract) |
| [27] |
Smith SE (1998). Variation in response to defoliation between populations of Bouteloua curtipendula var. caespitosa (Poaceae) with different livestock grazing histories. American Journal of Botany, 85, 1266-1272.
URL PMID |
| [28] |
Strauss SY, Agrawal AA (1999). The ecology and evolution of plant tolerance to herbivory. Trends in Ecology & Evolution, 14, 179-185.
DOI URL PMID |
| [29] |
Tiffin P (2000). Mechanisms of tolerance to herbivore damage: What do we know? Evolutionary Ecology, 14, 523-536.
DOI URL |
| [30] | Wang CT (王长庭), Long RJ (龙瑞军), Cao GM (曹广民), Wang QL (王启兰), Jing ZC (景增春), Shi JJ (施建军) (2008). The relationship between soil nutrients and diversity-productivity of different type grasslands in alpine meadow. Chinese Journal of Soil Science (土壤通报), 39, 1-8. (in Chinese with English abstract) |
| [31] | Wang CT (王长庭), Wang QJ (王启基), Shen ZX (沈振西), Peng HC (彭红春), Li HY (李海英) (2003). A preliminary study of the effect of simulated precipitation on an alpine Kobresia humilis meadow. Acta Prataculturae Sinica (草业学报), 12(2), 25-29. (in Chinese with English abstract) |
| [32] | Wang SP (汪诗平) (2004). Grazing resistance of rangeland plants. Chines Journal of Applied Ecology (应用生态学报), 15, 517-522. (in Chinese with English abstract) |
| [33] | Wang SP (汪诗平), Wang YF (王艳芬) (2001). Study on over-compensation growth of Cleistogenes squarrosa population in Inner Mongolia Steppe. Acta Botanica Sinica (植物学报), 43, 413-418. (in Chinese with English abstract) |
| [34] | Wang SP (汪诗平), Wang YF (王艳芬), Li YH (李永宏), Chen ZZ (陈佐忠) (1998). The influence of different stocking rates on herbage regrowth and aboveground net primary production. Acta Agrestia Sinica (草地学报), 6, 275-281. (in Chinese with English abstract) |
| [35] |
Williamson SC, Detling JK, Dodd JJ, Dyer MI (1989). Experimental evaluation of the grazing optimization hypothesis. Journal of Range Management, 42, 149-152.
DOI URL |
| [36] |
Wise MJ, Abrahamson WG (2005). Beyond the compensatory continuum: environmental resource levels and plant tolerance of herbivory. Oikos, 109, 417-428.
DOI URL |
| [37] |
Wise MJ, Abrahamson WG (2007). Effects of resource availability on tolerance of herbivory: a review and assessment of three opposing models. The American Naturalist, 169, 443-454.
DOI URL PMID |
| [38] | Yao DL (姚德良), Shen WM (沈卫明), Xie ZT (谢正桐), Zhou XM (周兴民), Wang QJ (王启基), Shen ZX (沈振西) (1996). Study on growth yield model of forage grass in high cold meadow. Acta Agrestia Sinica (草地学报), 4, 274-280. (in Chinese with English abstract) |
| [39] | Zhang JX (张金霞), Cao GM (曹广民) (1999). The nitrogen cycle in an alpine meadow ecosystem. Acta Ecologica Sinica (生态学报), 19, 509-513. (in Chinese with English abstract) |
| [40] | Zhao G (赵钢), Cui ZR (崔泽仁) (1999). Selective grazing of animals and the response of plants. Grassland of China (中国草地), 1, 62-67. (in Chinese with English abstract) |
| [41] | Zhao XQ, Zhou XM (1999). Ecological basis of alpine meadow ecosystem management in Tibet: Haibei Alpine Meadow Ecosystem Research Station. Ambio, 28, 642-647. |
| [42] | Zhou XM (周兴民), Wang QJ (王启基), Zhang YQ (张堰青), Zhao XQ (赵新全), Lin YP (林亚平) (1987). Quantitative analysis of succession law of the alpine meadow under the different grazing intensities. Acta Phytoecologica et Geobotanica Sinica (植物生态学与地植物学学报), 11, 276-285. (in Chinese with English abstract) |
| [1] | Li Yi, Huang Huan, Chao ZHAO Yan, CHEN Li-Tong. Effects of nutrient addition on community diversity and composition of alpine meadows across elevations [J]. Chin J Plant Ecol, 2026, 50(预发表): 0-. |
| [2] | JIANG Kang-Wei, LÜ Cheng, WANG Ya-Fei, LI Hong, ZHANG Zhi-Qing, WANG Yu, ZHANG Qing-Qing, Tuerxunnayi REYIMU. Effects of soil arbuscular mycorrhizal fungal communities on soil multifunctionality under grazing disturbance [J]. Chin J Plant Ecol, 2026, 50(3): 685-699. |
| [3] | ZHENG Zi-Yi, CHEN Jiang-Hui, LIU Hui-Ying. Climate warming increases root exudation rates of dominant species in alpine meadow on the Qingzang Plateau [J]. Chin J Plant Ecol, 2025, 49(9): 1363-1373. |
| [4] | LÜ Wei-Dong, DONG Quan-Min, SUN Cai-Cai, LIU Wen-Ting, LIU Yu-Zhen, ZHANG Zhen-Xiang, LI Meng-Qi, YANG Xiao-Xia. Effects of yak and Tibetan sheep grazing on plant and microbial carbon and nitrogen pools in alpine grassland [J]. Chin J Plant Ecol, 2025, 49(9): 1424-1433. |
| [5] | ZHANG Fa-Wei, LI Hong-Qin, ZHU Jing-Bin, FAN Bo, ZHOU Hua-Kun, LI Ying-Nian, LIANG Nai-Shen. Response of aboveground and belowground carbon storage to nitrogen addition and precipitation change in an alpine meadow ecosystem [J]. Chin J Plant Ecol, 2025, 49(9): 1399-1409. |
| [6] | CUI Dong-Qing, TIAN Chen, SONG Hui-Min, LU Xiao-Ming, SA Qi-Ri, XU Guo-Qing, YANG Pei-Zhi, BAI Yong-Fei, TIAN Jian-Qing. Response mechanisms of rhizosphere bacterial community diversity and functional group composition of dominant plants in typical grasslands to long-term grazing [J]. Chin J Plant Ecol, 2025, 49(7): 1163-1176. |
| [7] | MA Teng-Fei, HAO Jie, DIAO Hua-Jie, NING Ya-Nan, $\boxed{\hbox{WANG Chang-Hui}}$ , DONG Kuan-Hu. Seasonal variations of soil inorganic nitrogen contents and their responses to changing grazing intensity in grasslands of an agro-pastoral ecotone in northern Shanxi, China [J]. Chin J Plant Ecol, 2025, 49(6): 965-974. |
| [8] | WANG Juan, ZHANG Deng-Shan, XIAO Yuan-Ming, PEI Quan-Bang, WANG Bo, FAN Bo, ZHOU Guo-Ying. Relationships between the characteristics of root exudate and environmental factors in the alpine steppe following long-term grazing exclusion [J]. Chin J Plant Ecol, 2025, 49(4): 596-609. |
| [9] | GE Xiao-Cai, LI Jing-Long, SUN Jun, WU Pan-Pan, HU Dan-Dan, CHENG Dong-Liang, ZHONG Quan-Lin. Characteristics of soil respiration components and influencing factors in the subalpine meadows of Wuyi Mountain [J]. Chin J Plant Ecol, 2025, 49(3): 502-512. |
| [10] | HAN Da-Yong, LI Hai-Yan, ZHANG Wei, YANG Yun-Fei. Superior growth process of creeping ramets of Phragmites australis and its physiological mechanisms in an alkaline meadow in Northeast China [J]. Chin J Plant Ecol, 2025, 49(2): 320-330. |
| [11] | LIU Yang, LIU Ao, SONG Xuan-Zi, YANG Yun, AN Bai-Heng, HAN Meng-Jiao, Banma-Caigeer , Migmar-Wangdwei. Effects of plateau pika disturbance on the niche and interspecific associations of major plant species in alpine rangelands [J]. Chin J Plant Ecol, 2025, 49(12): 2054-2068. |
| [12] | MA Dong-Feng, JIA Cun-Zhi, WANG Xue-Peng, ZHAO Peng-Peng, HU Xiao-Wen. Effect of multi-species grouping on restoration of alpine degraded meadows in Gannan, China [J]. Chin J Plant Ecol, 2025, 49(1): 93-102. |
| [13] | ZHANG Hui, ZHAO Yun-Peng, LIU Xiao-Chen, GUO Zeng-Peng, HU Guo-Rui, FENG Yan-Hao, MA Miao-Jun. Dynamics of soil seed bank and its role in plant community regeneration during alpine meadow degradation [J]. Chin J Plant Ecol, 2025, 49(1): 74-82. |
| [14] | WANG Wen-Ying, XIAO Yuan-Ming, WANG Xiao-Yun, XU Jia-Xin, MA Yu-Hua, LI Qiang-Feng, ZHOU Guo-Ying. Relationship between plant diversity and ecosystem multifunctionality in degraded alpine meadows under multifunctional group species combination models [J]. Chin J Plant Ecol, 2025, 49(1): 103-117. |
| [15] | LI Tian-Qi, CAO Ji-Rong, LIU Xiao-Ni, TIAN Si-Hui, LAN Bo-Lan, QIU Ying, XUE Jian-Guo, ZHANG Qian, CHU Jian-Min, ZHANG Shu-Min, HUANG Jian-Hui, LI Ling-Hao, WANG Qi-Bing. Response of soil enzyme stoichiometry to grazing and identification of soil limiting nutrients in typical steppe of Nei Mongol, China [J]. Chin J Plant Ecol, 2025, 49(1): 19-29. |
| Viewed | ||||||
|
Full text |
|
|||||
|
Abstract |
|
|||||
Copyright © 2026 Chinese Journal of Plant Ecology
Tel: 010-62836134, 62836138, E-mail: apes@ibcas.ac.cn, cjpe@ibcas.ac.cn
![]()