
植物生态学报 ›› 2009, Vol. 33 ›› Issue (5): 833-841.DOI: 10.3773/j.issn.1005-264x.2009.05.001
• 研究论文 • 下一篇
张志东1,2, 臧润国2,*( )
)
收稿日期:2008-07-23
接受日期:2009-04-09
出版日期:2009-07-23
发布日期:2009-09-30
通讯作者:
臧润国
作者简介:*(zangrung@caf.ac.cn)基金资助:
ZHANG Zhi-Dong1,2, ZANG Run-Guo2,*()
Received:2008-07-23
Accepted:2009-04-09
Online:2009-07-23
Published:2009-09-30
Contact:
ZANG Run-Guo
摘要:
热带森林在全球碳循环方面扮演着重要的角色, 预测其生物量分布可以加深对碳循环过程的理解。然而目前基于植被指数模拟技术进行热带森林生物量分布的研究报道较少。该文以海南岛霸王岭林区热带森林为研究对象, 在基于遥感影像和135个公里网格样地调查的基础上, 分别选取归一化差异植被指数(NDVI)、短红外湿度植被指数(MVI5)、中红外湿度植被指数(MVI7)和比值植被指数(RVI)与总物种生物量、顶极种生物量和先锋种生物量做相关分析, 并利用逐步线性回归分析分别构建了基于植被指数的生物量回归模型; 利用残差图对模型的有效性进行检验。结果表明, MVI7和MVI5与总物种和顶极种生物量关系显著, 而NDVI和RVI对先锋种生物量具有较好的指示作用; 总物种、顶极种和先锋种生物量预测精度较高的区域分别占总面积的69.24%、73.98%和88.08%, 表明3个生物量模型均具有较好的拟合精度; 模拟结果表明总物种和顶极种生物量主要集中于研究区中部、北部和西南部区域, 而先锋种生物量无明显的分布规律, 是不均衡地散布于整个研究区域, 反映了群落组成结构、干扰历史、地形及气候因素等的影响。
张志东, 臧润国. 基于植被指数的海南岛霸王岭热带森林地上生物量空间分布模拟. 植物生态学报, 2009, 33(5): 833-841. DOI: 10.3773/j.issn.1005-264x.2009.05.001
ZHANG Zhi-Dong, ZANG Run-Guo. MODELLING THE SPATIAL DISTRIBUTION OF ABOVEGROUND BIOMASS BASED ON VEGETATION INDEX IN A TROPICAL FOREST IN BAWANG- LING, HAINAN ISLAND, SOUTH CHINA. Chinese Journal of Plant Ecology, 2009, 33(5): 833-841. DOI: 10.3773/j.issn.1005-264x.2009.05.001
| 植被指数 Vegetation indices | 缩写 Abbreviation | 公式 Formula |
|---|---|---|
| 归一化差异植被指数 Normalized difference vegetation index | NDVI | (NIR-R)/(NIR+R) |
| 短红外湿度植被指数 Moisture vegetation index using Landsat’s band 5 | MVI5 | (NIR-SWIR)/(NIR+SWIR) |
| 中红外湿度植被指数 Moisture vegetation index using Landsat’s band 7 | MVI7 | (NIR-MIR)/(NIR+MIR) |
| 比值植被指数 Ratio vegetation index | RVI | NIR/R |
表1 植被指数表
Table 1 The vegetation index
| 植被指数 Vegetation indices | 缩写 Abbreviation | 公式 Formula |
|---|---|---|
| 归一化差异植被指数 Normalized difference vegetation index | NDVI | (NIR-R)/(NIR+R) |
| 短红外湿度植被指数 Moisture vegetation index using Landsat’s band 5 | MVI5 | (NIR-SWIR)/(NIR+SWIR) |
| 中红外湿度植被指数 Moisture vegetation index using Landsat’s band 7 | MVI7 | (NIR-MIR)/(NIR+MIR) |
| 比值植被指数 Ratio vegetation index | RVI | NIR/R |
| NDVI | RVI | MVI7 | MVI5 | |
|---|---|---|---|---|
| 顶极种生物量 Climax species biomass | 0.286* | 0.249* | 0.497** | 0.503** |
| 先锋种生物量 Pioneer species biomass | 0.194* | 0.214* | 0.109 | 0.117 |
| 总生物量 Total biomass | 0.284* | 0.246* | 0.511** | 0.505** |
表2 地上生物量与TM影像植被指数的相关分析
Table 2 Correlations between aboveground biomass and vegetation index
| NDVI | RVI | MVI7 | MVI5 | |
|---|---|---|---|---|
| 顶极种生物量 Climax species biomass | 0.286* | 0.249* | 0.497** | 0.503** |
| 先锋种生物量 Pioneer species biomass | 0.194* | 0.214* | 0.109 | 0.117 |
| 总生物量 Total biomass | 0.284* | 0.246* | 0.511** | 0.505** |
| 模型 Model | R2 | F | p |
|---|---|---|---|
| 总生物量 Total biomass Ln(Y)=-53.186+11.325Ln(MVI7) | 0.761 | 42.407 | <0.000 1 |
| 顶极种生物量 Climax species biomass Ln(Y)= -40.766+9.509Ln(MVI5) | 0.753 | 40.579 | <0.000 1 |
| 先锋种生物量 Pioneer species biomass Ln(Y)= -36.072+7.674Ln(RVI) | 0.446 | 5.765 | 0.018 |
表3 植被指数与地上生物量的线性回归模型
Table 3 Linear regression models using aboveground biomass as the dependent variables and vegetation indices as the independent variables
| 模型 Model | R2 | F | p |
|---|---|---|---|
| 总生物量 Total biomass Ln(Y)=-53.186+11.325Ln(MVI7) | 0.761 | 42.407 | <0.000 1 |
| 顶极种生物量 Climax species biomass Ln(Y)= -40.766+9.509Ln(MVI5) | 0.753 | 40.579 | <0.000 1 |
| 先锋种生物量 Pioneer species biomass Ln(Y)= -36.072+7.674Ln(RVI) | 0.446 | 5.765 | 0.018 |
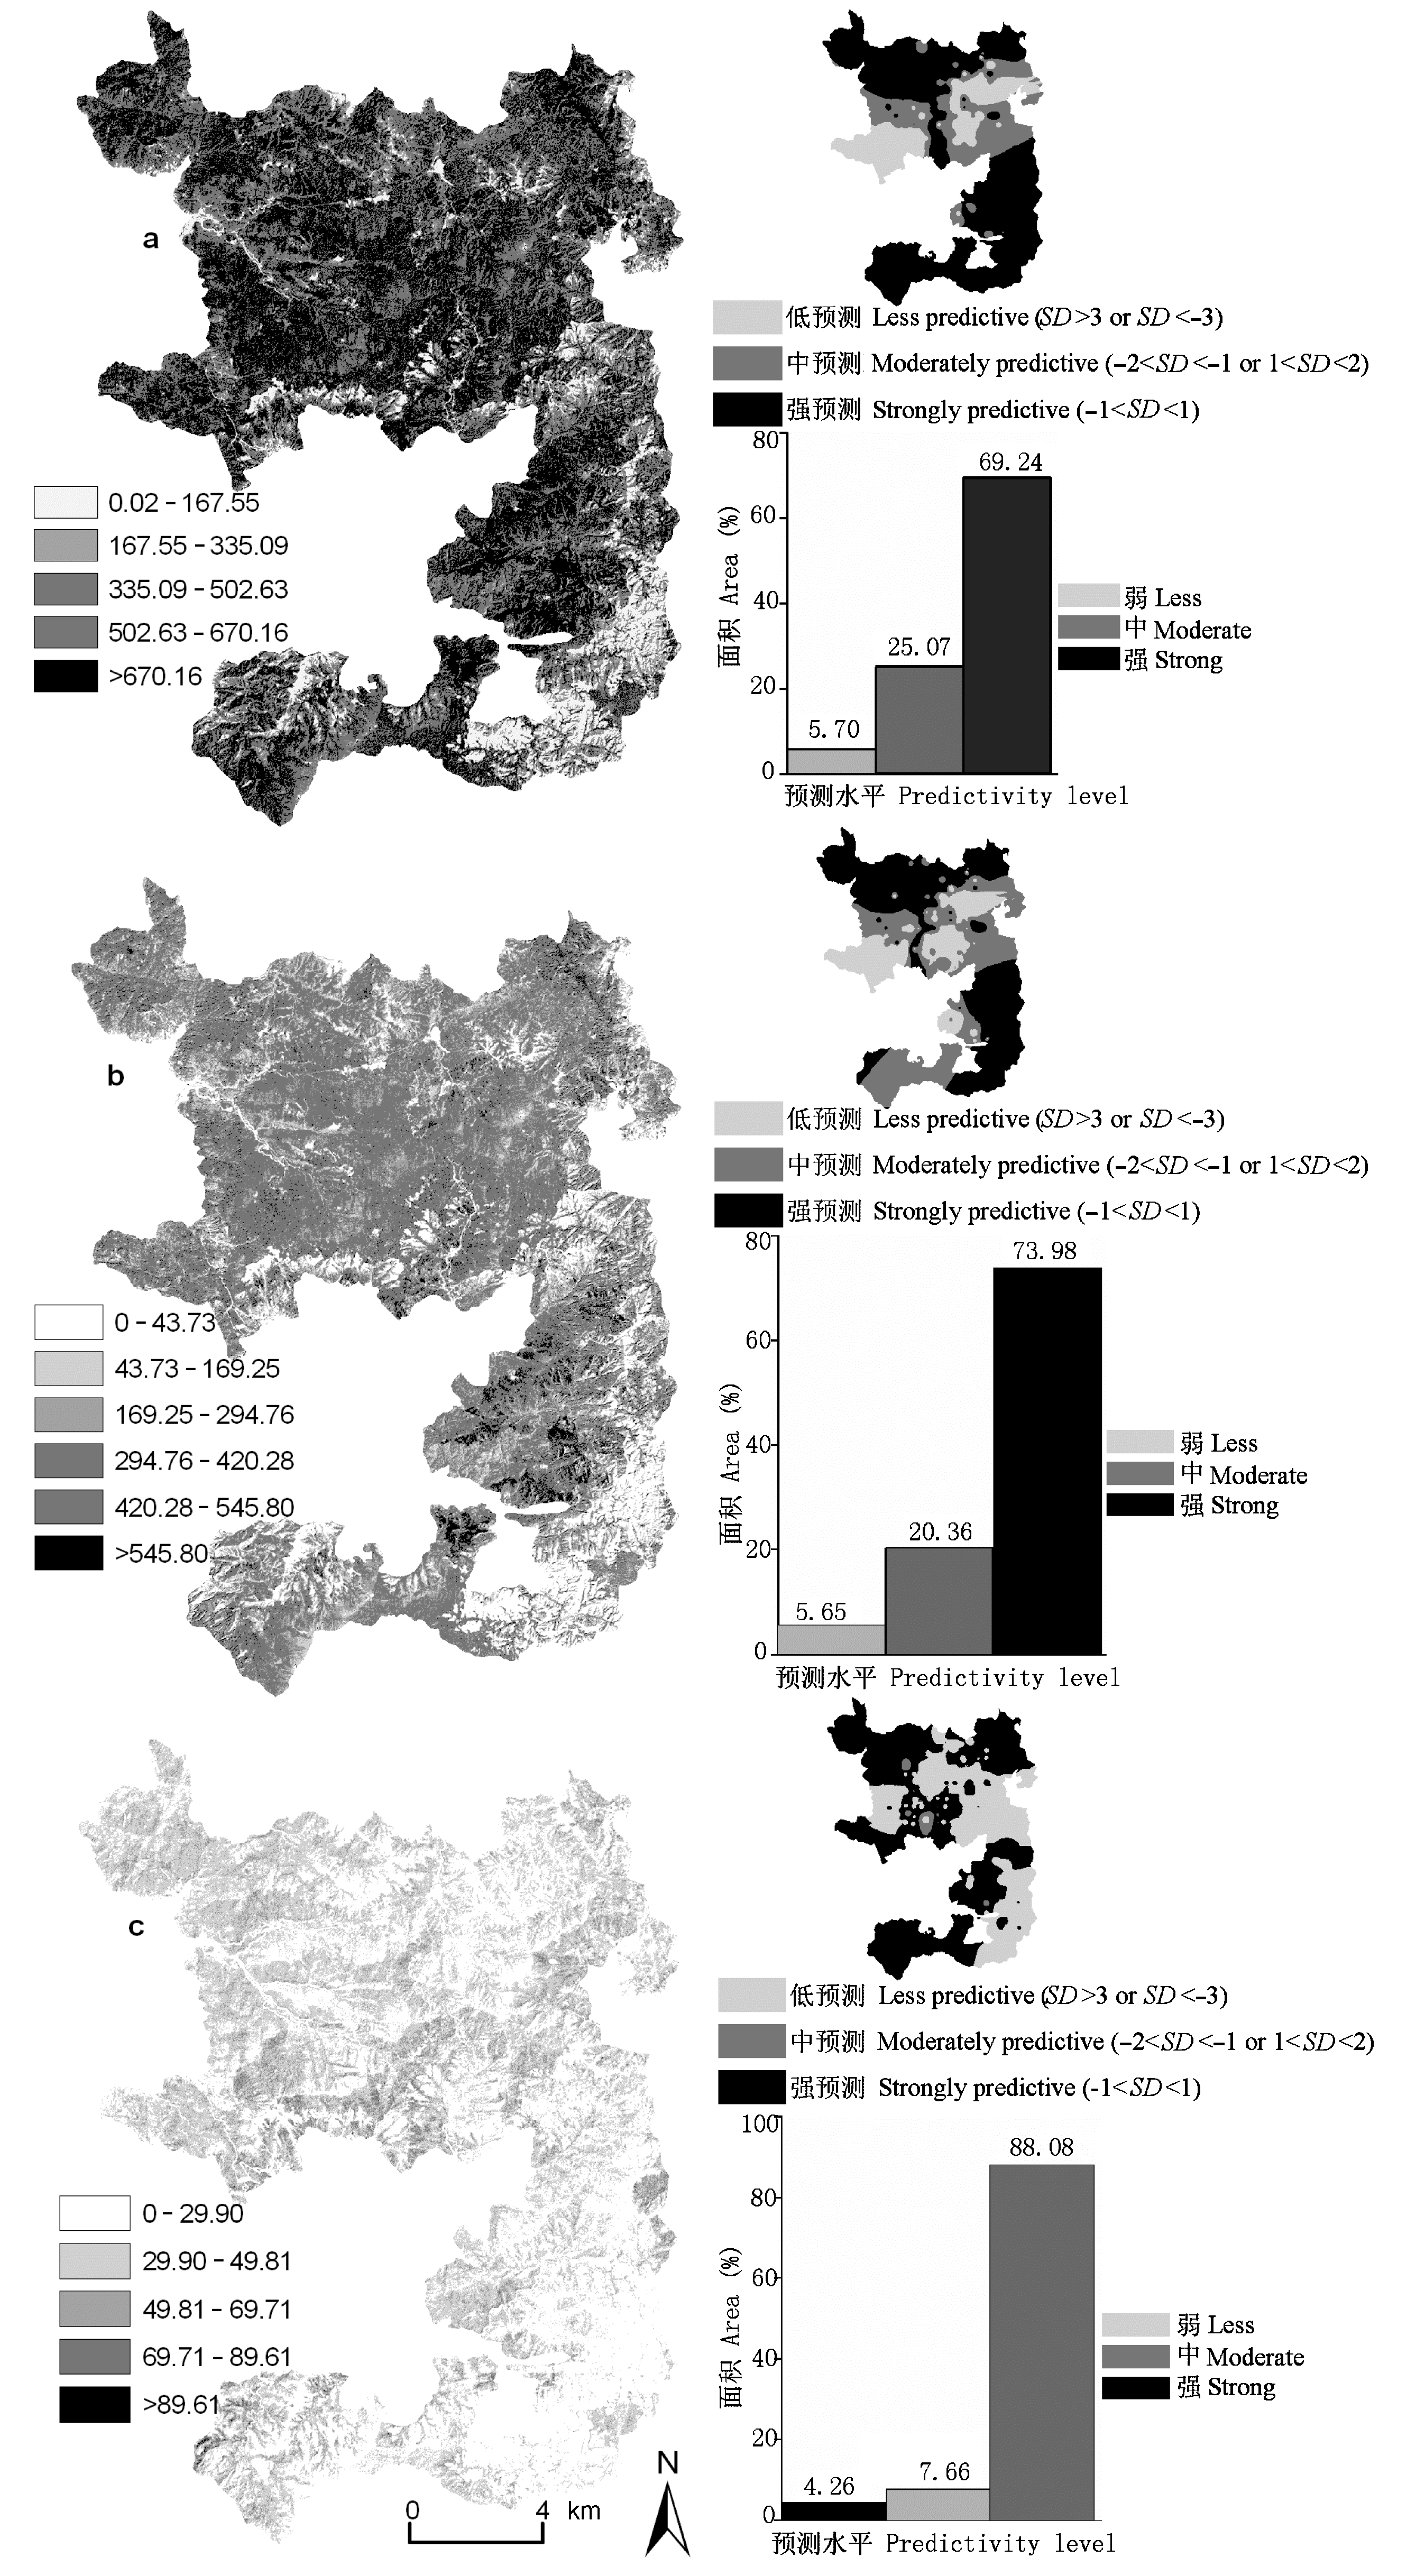
图1 总物种(a)、顶极种(b)和先锋种(c)地上生物量(1 000 kg·hm-2)分布与残差统计图
Fig. 1 Aboveground biomass (1 000 kg·hm-2) distribution and residual statistics maps of total species (a),climax (b) and pioneer species (c)
| [1] |
Boyd DS, Foody GM, Curran PJ (1999). The relationship between the biomass of Cameroonian tropical forests and radiation reflected in middle infrared wavelengths (3.0-5.0 μm). International Journal of Remote Sensing, 20, 1017-1023.
DOI URL |
| [2] |
Boyd DS, Foody GM, Curran PJ, Lucas RM, Honzák M (1996). An assessment of radiance in Landsat TM middle and thermal infrared wavebands for the detection of tropical forest regeneration. International Journal of Remote Sensing, 17, 249-261.
DOI URL |
| [3] |
Carlson T, Ripley D (1997). On the relation between NDVI, fractional vegetation cover, and leaf area index. Remote Sensing of Environment, 62, 241-252.
DOI URL |
| [4] |
Chave J, Condit R, Aguilar S, Hernandez A, Lao S, Perez R (2004). Error propogation and scaling for tropical forest biomass estimates. Philosophical Transactions of the Royal Society of London, Series B, 359, 409-420.
DOI URL PMID |
| [5] |
Chave J, Riéra B, Dubois MA (2001). Estimation of biomass in a neotropical forest of French Guiana: spatial and temporal variability. Journal of Tropical Ecology, 17, 79-96.
DOI URL |
| [6] |
Coomes DA, Grubb PJ (2003). Colonization, tolerance, competition and seed-size variation within functional groups. Trends in Ecology & Evolution, 18, 283-291.
DOI URL |
| [7] |
Dalling JW, Hubbell SP (2002). Seed size, growth rate and gap microsite conditions as determinants of recruitment success for pioneer species. Journal of Ecology, 90, 557-568.
DOI URL |
| [8] |
Dogan H, Dogan M (2006). A new approach to diversity indices―Modeling and mapping plant biodiversity of nallihan (A3-Ankara/Turkey) forest ecosystem in frame of geographic information systems. Biodiversity and Conservation, 15, 855-878.
DOI URL |
| [9] |
Dong J, Kaufmann RK, Myneni RB, Tucker CJ, Kauppi PE, Liski J, Buermann W, Alexeyev V, Hughes MK (2003). Remote sensing estimates of boreal and temperate forest woody biomass: carbon pools, sources, and sinks. Remote Sensing of Environment, 84, 393-410.
DOI URL |
| [10] | ESRI (2003). ARCGIS. Environmental Systems Research Institute, Inc., Redcands, California,USA. |
| [11] |
Foody GM, Boyd DS, Cutler MEJ (2003). Predictive relations of tropical forest biomass from Landsat TM data and their transferability between regions. Remote Sensing of Environment, 85, 463-474.
DOI URL |
| [12] |
Foody GM, Cutler ME, McMorrow J, Pelz D, Tangki H, Boyd DS, Douglas I (2001). Mapping the biomass of Bornean tropical rain forest from remotely sensed data. Global Ecology and Biogeography, 10, 379-387.
DOI URL |
| [13] |
Freitas SR, Mello MCS, Cruz CBM (2005). Relationships between forest structure and vegetation indices in Atlantic rainforest. Forest Ecology and Management, 218, 353-362.
DOI URL |
| [14] |
Gamon JA, Field CB, Goulden ML, Griffin KL, Hartley AE, Joel G, Penuelas J, Valentini R (1995). Relationships between NDVI, canopy structure, and photosynthesis in three Californian vegetation types. Ecological Applications, 5, 28-41.
DOI URL |
| [15] |
Garkoti SC (2008). Estimates of biomass and primary productivity in a high-altitude maple forest of the west central Himalayas. Ecological Research, 23, 41-49.
DOI URL |
| [16] |
Haripriya G (2000). Estimates of biomass in Indian forests. Biomass and Bioenergy, 19, 245-258.
DOI URL |
| [17] |
Houghton RA, Skole DL, Nobre CA, Hackler JL, Lawrence KT, Chomentowski WH (2000). Annual fluxes of carbon from deforestation and regrowth in the Brazilian Amazon. Nature, 403, 301-304.
DOI URL PMID |
| [18] | Jiang YX (蒋有绪), Wang BS (王伯荪), Zang RG (臧润国), Jin JH (金建华), Liao WB (廖文波) (2002). Biodiversity and Mechanism of Maintenance of the Tropical Forest in Hainan Island(海南岛热带林生物多样性及其形成机制). Science Press, Beijing, 219-324. (in Chinese) |
| [19] |
Kitayama K, Itow S (1999). Aboveground biomass and soil nutrient pools of a Scalesia pedunculata montane forest on Santa Cruz, Galápagos. Ecological Research, 14, 405-408.
DOI URL |
| [20] |
Köhler P, Ditzer T, Huth A (2000). Concepts for the aggregation of tropical tree species into functional types and application to Sabah’s lowland rain forest. Journal of Tropical Ecology, 16, 591-602.
DOI URL |
| [21] | Li YD (李意德) (1993). Comparative analysis for biomass measurement of tropical mountain rain forest in Hainan Island, China. Acta Ecologica Sinica (生态学报), 13, 313-320. (in Chinese with English abstract) |
| [22] | Li SY (李素英), Li XB (李晓兵), Ying G (莺歌), Fu N (符娜) (2007). Vegetation indexes-biomass models for typical semi-arid steppe—A case study for Xilinhot in Northern China. Journal of Plant Ecology (Chinese Version)(植物生态学报), 31, 23-31. (in Chinese with English abstract) |
| [23] |
Lu D, Mausel P, Brondizio E, Moran E (2004). Relationships between forest stand parameters and Landsat TM spectral responses in the Brazilian Amazon Basin. Forest Ecology and Management, 198, 149-167.
DOI URL |
| [24] | Lu Y (陆阳), Li MG (李鸣光), Huang YW (黄雅文), Chen ZH (陈章和), Hu YJ (胡玉佳) (1986). Vegetation of Bawangling gibbon natural reserve, in Hainan Island. Acta Phytoecologica et Geobotanica Sinica (植物生态学与地植物学学报), 10, 106-114. (in Chinese with English abstract) |
| [25] |
Phua MH, Saito H (2003). Estimation of biomass of a mountainous tropical forest using Landsat TM data. Canadian Journal of Remote Sensing, 29, 429-440.
DOI URL |
| [26] |
Saatchi SS, Houghton RA, Dos Santos Alvala RC, Soares JV, Yu Y (2007). Distribution of aboveground live biomass in the Amazon basin. Global Change Biology, 13, 816-837.
DOI URL |
| [27] | SPSS (2004). SPSS for windows, Version 13.0. Chicago. |
| [28] |
Swaine MD, Whitmore TC (1988). On the definition of ecological species groups in tropical forests. Vegetatio, 75, 81-86.
DOI URL |
| [29] |
Tan K, Piao S, Peng C, Fang J (2007). Satellite-based estimation of biomass carbon stocks for northeast China’s forests between 1982 and 1999. Forest Ecology and Management, 240, 114-121.
DOI URL |
| [30] |
Todd SW, Hoffer RM, Milchunas DG (1998). Biomass estimation on grazed and ungrazed rangelands using spectral indices. International Journal of Remote Sensing, 19, 427-438.
DOI URL |
| [31] |
Vanclay JK (1995). Growth models for tropical forests: a synthesis of models and methods. Forest Science, 41, 7-42.
DOI URL |
| [32] |
Verburg R, van Eijk-Bos C (2003). Effects of selective logging on tree diversity, composition and plant functional type patterns in a Bornean rain forest. Journal of Vegetation Science, 14, 99-110.
DOI URL |
| [33] | Wang ZX (王正兴), Liu C (刘闯), Huete AL (2003). From AVHRR-NDVI to MODIS-EVI: advances in vegetation index research. Acta Ecologica Sinica (生态学报), 23, 979-987. (in Chinese with English abstract) |
| [34] | Zang RG (臧润国), An SQ (安树青), Tao JP (陶建平), Jiang YX (蒋有绪), Wang BX (王伯荪) (2004). Biodiversity and Mechanism of Maintenance of the Tropical Forest in Hainan Island (海南岛热带林生物多样性维持机制). Science Press,Beijing, 1-169. (in Chinese) |
| [1] | 赵艳超, 陈立同. 土壤养分对青藏高原高寒草地生物量响应增温的调节作用[J]. 植物生态学报, 2023, 47(8): 1071-1081. |
| [2] | 陈雪萍, 赵学勇, 张晶, 王瑞雄, 卢建男. 基于地理探测器的科尔沁沙地植被NDVI时空变化特征及其驱动因素[J]. 植物生态学报, 2023, 47(8): 1082-1093. |
| [3] | 张慧玲, 张耀艺, 彭清清, 杨静, 倪祥银, 吴福忠. 中亚热带同质园不同生活型树种微量元素重吸收效率的差异[J]. 植物生态学报, 2023, 47(7): 978-987. |
| [4] | 郭敏, 罗林, 梁进, 王彦杰, 赵春章. 冻融变化对西南亚高山森林优势种云杉和华西箭竹根区土壤理化性质与酶活性的影响[J]. 植物生态学报, 2023, 47(6): 882-894. |
| [5] | 万春燕, 余俊瑞, 朱师丹. 喀斯特与非喀斯特森林乔木叶性状及其相关性网络的差异[J]. 植物生态学报, 2023, 47(10): 1386-1397. |
| [6] | 缪丽娟, 张宇阳, 揣小伟, 包刚, 何昱, 朱敬雯. 亚洲旱区草地NDVI对气候变化的响应及滞后效应[J]. 植物生态学报, 2023, 47(10): 1375-1385. |
| [7] | 郝晴, 黄昌. 森林地上生物量遥感估算研究综述[J]. 植物生态学报, 2023, 47(10): 1356-1374. |
| [8] | 朱玉英, 张华敏, 丁明军, 余紫萍. 青藏高原植被绿度变化及其对干湿变化的响应[J]. 植物生态学报, 2023, 47(1): 51-64. |
| [9] | 董六文, 任正炜, 张蕊, 谢晨笛, 周小龙. 功能多样性比物种多样性更好解释氮添加对高寒草地生物量的影响[J]. 植物生态学报, 2022, 46(8): 871-881. |
| [10] | 陈奕竹, 郎伟光, 陈效逑. 中国北方树木秋季物候的过程模拟及其区域分异归因[J]. 植物生态学报, 2022, 46(7): 753-765. |
| [11] | 陈丽, 田新民, 任正炜, 董六文, 谢晨笛, 周小龙. 养分添加对天山高寒草地植物多样性和地上生物量的影响[J]. 植物生态学报, 2022, 46(3): 280-289. |
| [12] | 原媛, 母艳梅, 邓钰洁, 李鑫豪, 姜晓燕, 高圣杰, 查天山, 贾昕. 植被覆盖度和物候变化对典型黑沙蒿灌丛生态系统总初级生产力的影响[J]. 植物生态学报, 2022, 46(2): 162-175. |
| [13] | 文可, 姚焕玫, 龚祝清, 纳泽林, 韦毅明, 黄以, 陈华权, 廖鹏任, 唐丽萍. 水淹频率变化对鄱阳湖增强型植被指数的影响[J]. 植物生态学报, 2022, 46(2): 148-161. |
| [14] | 黄侩侩, 胡刚, 庞庆玲, 张贝, 何业涌, 胡聪, 徐超昊, 张忠华. 放牧对中国亚热带喀斯特山地灌草丛物种组成与群落结构的影响[J]. 植物生态学报, 2022, 46(11): 1350-1363. |
| [15] | 刘宁, 彭守璋, 陈云明. 气候因子对青藏高原植被生长的时间效应[J]. 植物生态学报, 2022, 46(1): 18-26. |
| 阅读次数 | ||||||
|
全文 |
|
|||||
|
摘要 |
|
|||||
Copyright © 2022 版权所有 《植物生态学报》编辑部
地址: 北京香山南辛村20号, 邮编: 100093
Tel.: 010-62836134, 62836138; Fax: 010-82599431; E-mail: apes@ibcas.ac.cn, cjpe@ibcas.ac.cn
备案号: 京ICP备16067583号-19