
植物生态学报 ›› 2011, Vol. 35 ›› Issue (11): 1117-1126.DOI: 10.3724/SP.J.1258.2011.01117
余振1, 孙鹏森1,*( ), 刘世荣2
收稿日期:2011-05-18
接受日期:2011-08-01
出版日期:2011-05-18
发布日期:2011-11-07
通讯作者:
孙鹏森
作者简介:*(E-mail:sunpsen@forestry.ac.cn)
YU Zhen1, SUN Peng-Sen1,*(), LIU Shi-Rong2
Received:2011-05-18
Accepted:2011-08-01
Online:2011-05-18
Published:2011-11-07
Contact:
SUN Peng-Sen
摘要:
植被的动态变化及其与环境的关系已成为全球变化研究的热点问题。陆地样带是进行全球变化驱动因素梯度分析的有效途径。该研究依托中国东部南北样带(NSTEC), 对南北样带不同时间尺度的气候因子和植被活动变化特征进行了分析, 并重点阐述了具有代表性的12种植被类型对气候因子的响应方式。研究结果表明: 南北样带植被的归一化植被指数(NDVI)的变化同时受控于气温和降水, 但是在不同的空间和时间尺度上植被NDVI的响应方式各异。在年时间尺度上, 只有温带落叶灌丛(TDS)的NDVI受气温控制; 而温带禾草草原(TGS)和亚热带和热带针叶林(STCF)的NDVI同时受气温和降水调控。其他植被类型的年NDVI与年平均气温和年总降水量没有直接显著的联系, 而受年内气温变化和降水分配状况的影响更大。在月时间尺度上, NDVI与气温的关系在不同类型植被之间存在很大差异。一般而言, 植被NDVI与前4个月内的气温关系最为密切, 并且从1月份到4月份气温的滞后时长在缩短。其中, 温带针叶林(TCF)、温带落叶阔叶林(TDBF)、TDS、STCF和亚热带热带草丛(STG)等植被类型, 5-8月的NDVI与气温普遍呈负相关关系。草原和灌丛植被类型当月NDVI与当月降水量主要以正相关为主, 而森林类型当月NDVI与当月降水量主要以负相关为主。
余振, 孙鹏森, 刘世荣. 中国东部南北样带主要植被类型归一化植被指数对气候变化的响应及不同时间尺度的差异性. 植物生态学报, 2011, 35(11): 1117-1126. DOI: 10.3724/SP.J.1258.2011.01117
YU Zhen, SUN Peng-Sen, LIU Shi-Rong. Response of normalized difference vegetation index in main vegetation types to climate change and their variations in different time scales along a North-South Transect of Eastern China. Chinese Journal of Plant Ecology, 2011, 35(11): 1117-1126. DOI: 10.3724/SP.J.1258.2011.01117
| 植被类型 Vegetation type | 英文名 English name | 缩写 Abbreviations | 分布纬度(° N) Distributional latitude | NDVI范围 NDVIrange |
|---|---|---|---|---|
| 寒温带温带针叶林 | Temperate and cold temperate coniferous forest | TCTCF | 48-53 | 0.11-0.77 |
| 温带针叶林 | Temperate coniferous forest | TCF | 32-42 | 0.21-0.59 |
| 温带针阔叶混交林 | Temperate mixed forest | TMF | 40-47 | 0.20-0.77 |
| 温带落叶阔叶林 | Temperate deciduous broad-leaved forest | TDBF | 32-53 | 0.16-0.70 |
| 温带落叶灌丛 | Temperate deciduous shrubland | TDS | 30-50 | 0.18-0.61 |
| 温带草甸草原 | Temperate meadow steppe | TMS | 35-53 | 0.11-0.67 |
| 温带禾草草原 | Temperate grass steppe | TGS | 36-50 | 0.12-0.43 |
| 温带草丛 | Temperate grassland | TG | 30-42 | 0.20-0.55 |
| 亚热带和热带针叶林 | Subtropical and tropical coniferous forest | STCF | 21-34 | 0.33-0.61 |
| 亚热带落叶阔叶林 | Subtropical deciduous broad-leaved forest | SDBF | 25-35 | 0.30-0.63 |
| 亚热带常绿阔叶林 | Subtropical evergreen broad-leaved forest | SEBF | 22-31 | 0.35-0.63 |
| 亚热带和热带草丛 | Subtropical and tropical grassland | STG | 18-34 | 0.31-0.59 |
表1 中国东部南北样带上天然植被类型及其分布概况
Table 1 Natural vegetation types and their distribution along the North-South Transect of Eastern China
| 植被类型 Vegetation type | 英文名 English name | 缩写 Abbreviations | 分布纬度(° N) Distributional latitude | NDVI范围 NDVIrange |
|---|---|---|---|---|
| 寒温带温带针叶林 | Temperate and cold temperate coniferous forest | TCTCF | 48-53 | 0.11-0.77 |
| 温带针叶林 | Temperate coniferous forest | TCF | 32-42 | 0.21-0.59 |
| 温带针阔叶混交林 | Temperate mixed forest | TMF | 40-47 | 0.20-0.77 |
| 温带落叶阔叶林 | Temperate deciduous broad-leaved forest | TDBF | 32-53 | 0.16-0.70 |
| 温带落叶灌丛 | Temperate deciduous shrubland | TDS | 30-50 | 0.18-0.61 |
| 温带草甸草原 | Temperate meadow steppe | TMS | 35-53 | 0.11-0.67 |
| 温带禾草草原 | Temperate grass steppe | TGS | 36-50 | 0.12-0.43 |
| 温带草丛 | Temperate grassland | TG | 30-42 | 0.20-0.55 |
| 亚热带和热带针叶林 | Subtropical and tropical coniferous forest | STCF | 21-34 | 0.33-0.61 |
| 亚热带落叶阔叶林 | Subtropical deciduous broad-leaved forest | SDBF | 25-35 | 0.30-0.63 |
| 亚热带常绿阔叶林 | Subtropical evergreen broad-leaved forest | SEBF | 22-31 | 0.35-0.63 |
| 亚热带和热带草丛 | Subtropical and tropical grassland | STG | 18-34 | 0.31-0.59 |
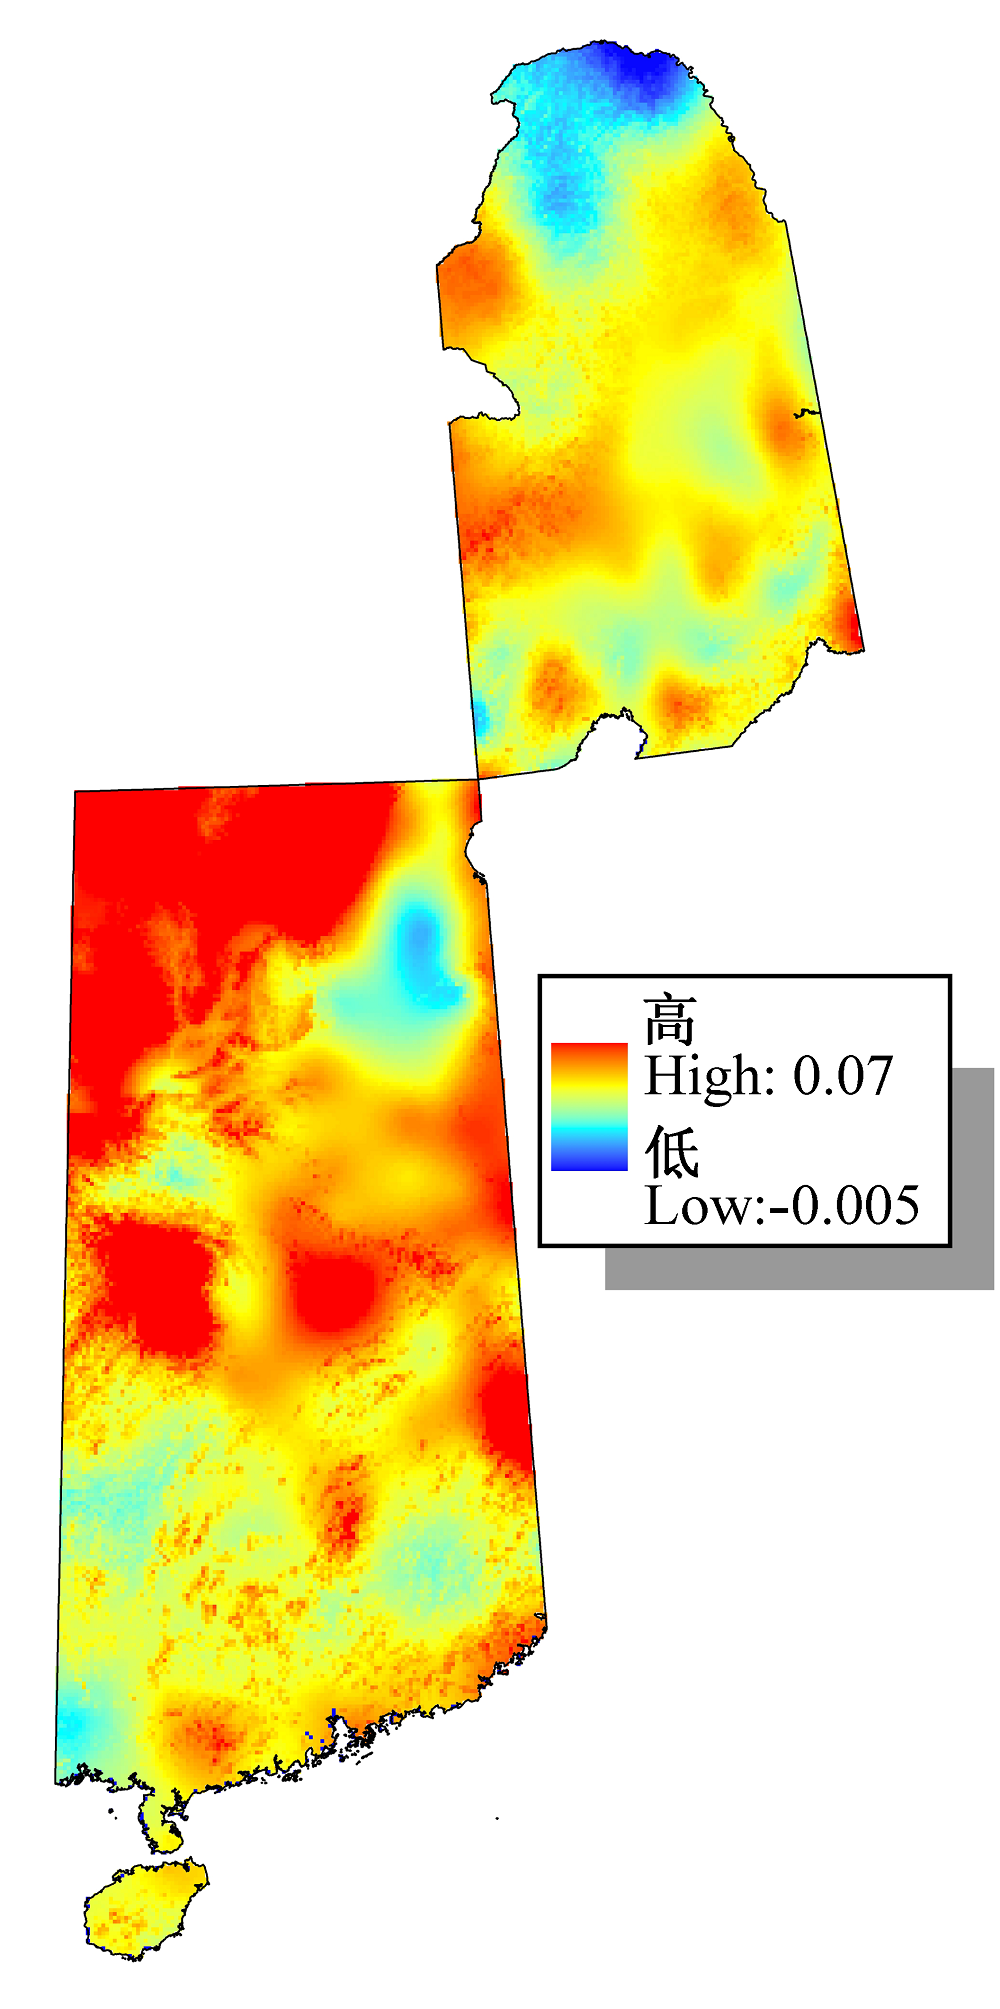
图1 1982-2006年中国东部南北样带年平均气温趋势(℃·a-1)。
Fig. 1 Trend of mean annual air temperature in North-South Transect of Eastern China from 1982 to 2006 (℃·a-1).
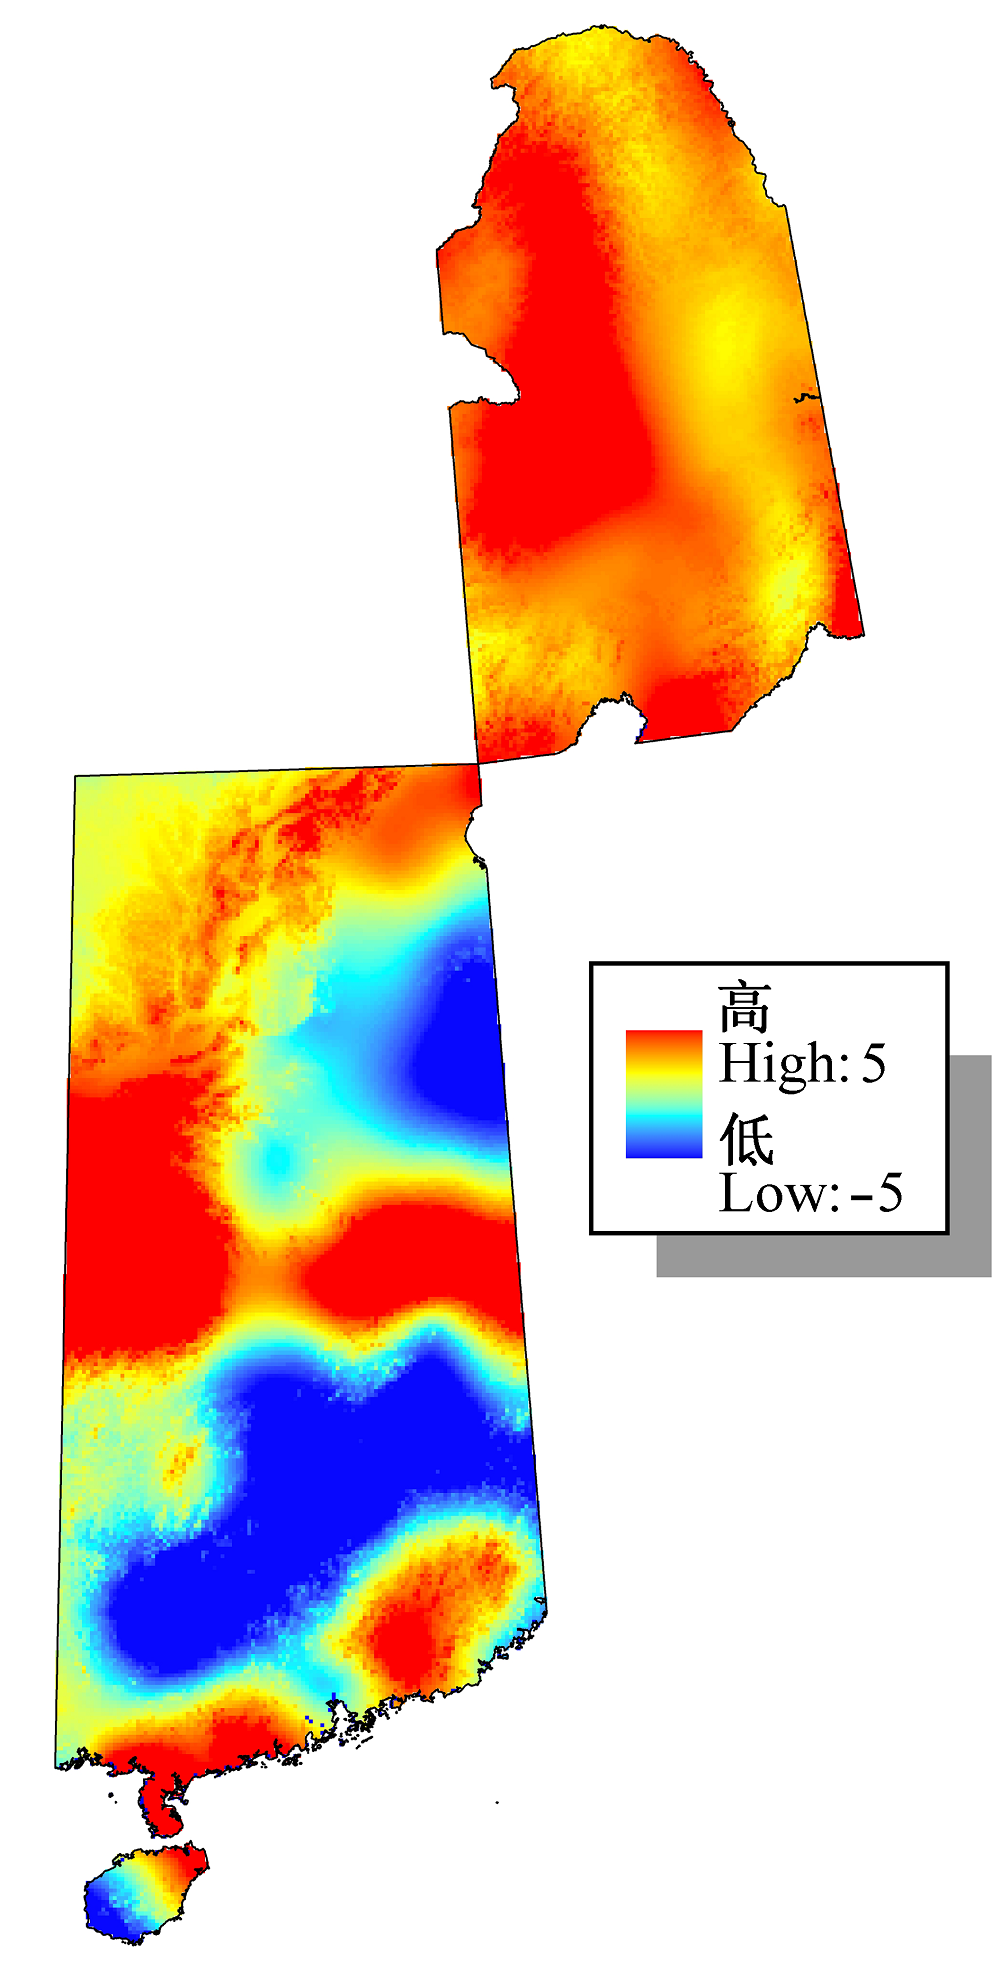
图2 1982-2006年中国东部南北样带年平均降水趋势(mm·a-1)。
Fig. 2 Trend of mean annual precipitation in North-South Transect of Eastern China from 1982 to 2006 (mm·a-1).
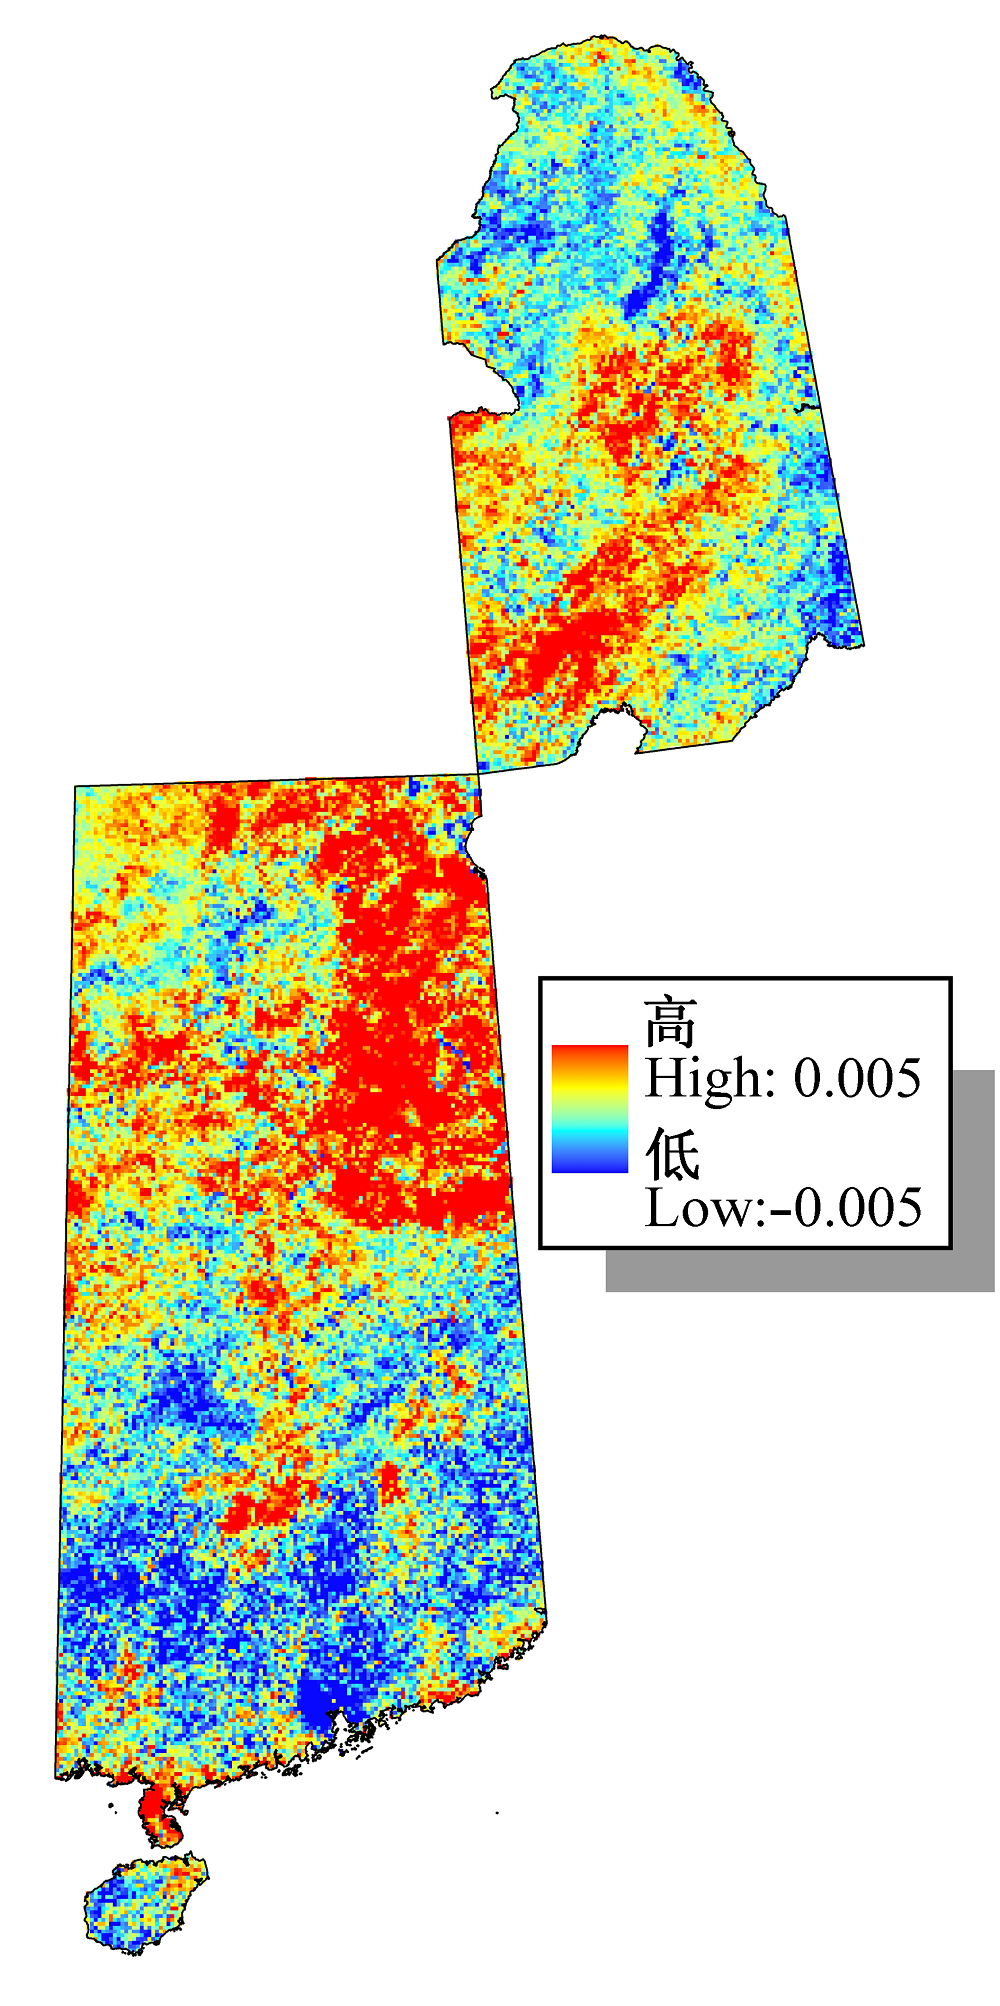
图3 1982-2006年中国东部南北样带年平均归一化植被指数趋势。
Fig. 3 Trend of mean annual normalized difference vegetation index in North-South Transect of Eastern China from 1982 to 2006.
| 植被类型 Vegetation type | ||||||||||||
|---|---|---|---|---|---|---|---|---|---|---|---|---|
| TCTCF | TCF | TMF | TDBF | TDS | TMS | TGS | TG | STCF | STG | SDBF | SEBF | |
| r t | 0.07 | 0.34 | -0.05 | 0.28 | 0.51** | 0.11 | 0.34 | 0.36 | 0.52** | -0.18 | 0.34 | -0.22 |
| r p | -0.18 | -0.35 | 0.05 | -0.18 | 0.10 | 0.22 | 0.32 | -0.03 | -0.44* | 0.08 | -0.19 | -0.09 |
| rNDVI-tp | 0.19 | 0.40 | 0.06 | 0.30 | 0.57* | 0.26 | 0.51* | 0.38 | 0.55* | 0.20 | 0.35 | 0.23 |
表2 中国东部南北样带不同植被类型年平均归一化植被指数(NDVI)与气温和降水的相关系数(1982-2006年)
Table 2 Correlation coefficients between mean annual normalized difference vegetation index (NDVI) and air temperature and precipitation for different vegetation types in North-South Transect of Eastern China from 1982 to 2006
| 植被类型 Vegetation type | ||||||||||||
|---|---|---|---|---|---|---|---|---|---|---|---|---|
| TCTCF | TCF | TMF | TDBF | TDS | TMS | TGS | TG | STCF | STG | SDBF | SEBF | |
| r t | 0.07 | 0.34 | -0.05 | 0.28 | 0.51** | 0.11 | 0.34 | 0.36 | 0.52** | -0.18 | 0.34 | -0.22 |
| r p | -0.18 | -0.35 | 0.05 | -0.18 | 0.10 | 0.22 | 0.32 | -0.03 | -0.44* | 0.08 | -0.19 | -0.09 |
| rNDVI-tp | 0.19 | 0.40 | 0.06 | 0.30 | 0.57* | 0.26 | 0.51* | 0.38 | 0.55* | 0.20 | 0.35 | 0.23 |
| 响应方式 Response mode | ||||
|---|---|---|---|---|
| 受降水控制百分数 Percentage dominated by precipitation (%) | 受气温控制百分数 Percentage dominated by air temperature (%) | 受气温和降水控制百分数(%) Percentage dominated by precipitation and air temperature | 不受气温和降水控制百分数(%) Percentage not dominated by precipitation and air temperature | |
| TCTCF | 9.12 | 1.23 | 0.00 | 89.82 |
| TCF | 12.50 | 25.00 | 0.00 | 75.00 |
| TMF | 0.00 | 7.14 | 0.00 | 92.86 |
| TDBF | 3.85 | 19.23 | 0.00 | 76.92 |
| TDS | 4.13 | 30.58 | 2.48 | 64.46 |
| TMS | 4.89 | 10.90 | 2.26 | 81.95 |
| TGS | 23.95 | 21.57 | 3.11 | 51.74 |
| TG | 5.00 | 20.00 | 7.50 | 70.00 |
| STCF | 12.50 | 62.50 | 0.00 | 37.50 |
| SDBF | 10.26 | 28.21 | 2.56 | 64.10 |
| SEBF | 10.53 | 12.28 | 3.51 | 77.19 |
| STG | 8.91 | 15.84 | 0.99 | 76.24 |
表3 中国东部南北样带自然植被对气温和降水不同响应方式的比较
Table 3 Composition of natural vegetation response mode to air temperature and precipitation in North-South Transect of Eastern China
| 响应方式 Response mode | ||||
|---|---|---|---|---|
| 受降水控制百分数 Percentage dominated by precipitation (%) | 受气温控制百分数 Percentage dominated by air temperature (%) | 受气温和降水控制百分数(%) Percentage dominated by precipitation and air temperature | 不受气温和降水控制百分数(%) Percentage not dominated by precipitation and air temperature | |
| TCTCF | 9.12 | 1.23 | 0.00 | 89.82 |
| TCF | 12.50 | 25.00 | 0.00 | 75.00 |
| TMF | 0.00 | 7.14 | 0.00 | 92.86 |
| TDBF | 3.85 | 19.23 | 0.00 | 76.92 |
| TDS | 4.13 | 30.58 | 2.48 | 64.46 |
| TMS | 4.89 | 10.90 | 2.26 | 81.95 |
| TGS | 23.95 | 21.57 | 3.11 | 51.74 |
| TG | 5.00 | 20.00 | 7.50 | 70.00 |
| STCF | 12.50 | 62.50 | 0.00 | 37.50 |
| SDBF | 10.26 | 28.21 | 2.56 | 64.10 |
| SEBF | 10.53 | 12.28 | 3.51 | 77.19 |
| STG | 8.91 | 15.84 | 0.99 | 76.24 |
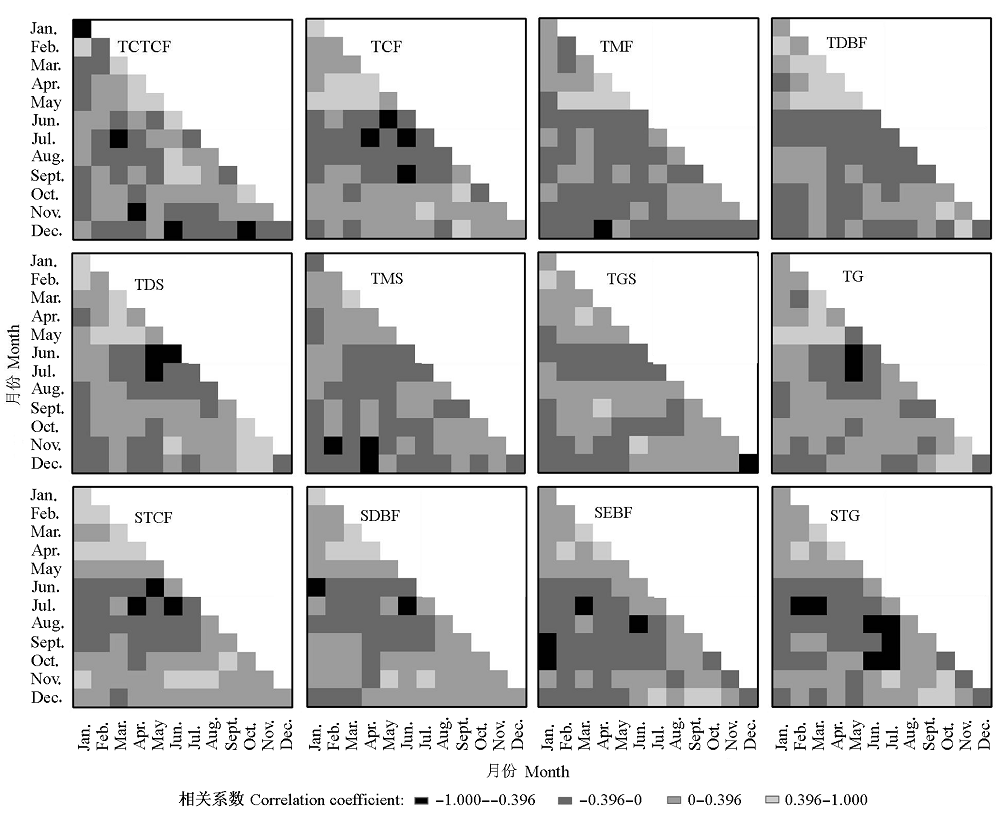
图4 中国东部南北样带各植被类型不同月份归一化植被指数与气温的相关关系。缩写同表1。
Fig. 4 Correlation coefficients between normalized difference vegetation index and air temperature in different months and vegetation types in North-South Transect of Eastern China. Abbreviations are the same as in Table 1.
| 月 Month | 植被类型 Vegetation type | ||||||||||||
|---|---|---|---|---|---|---|---|---|---|---|---|---|---|
| TCTCF | TCF | TMF | TDBF | TDS | TMS | TGS | TG | STCF | STG | SDBF | SEBF | ||
| 1月 January | 气温 Air temperature | Ο | Ο | Ο | Ο | Ο | Ο | Ο | + | Ο | Ο | Ο | Ο |
| 降水 Precipitation | Ο | Ο | Ο | Ο | Ο | Ο | Ο | Ο | Ο | Ο | Ο | Ο | |
| NDVI | - | Ο | Ο | Ο | Ο | Ο | Ο | Ο | + | - | Ο | Ο | |
| 2月 February | 气温 Air temperature | Ο | ++ | ++ | ++ | ++ | + | ++ | ++ | ++ | ++ | ++ | ++ |
| 降水量 Precipitation | Ο | Ο | Ο | Ο | Ο | Ο | Ο | Ο | Ο | - | Ο | Ο | |
| NDVI | Ο | Ο | Ο | Ο | Ο | Ο | Ο | Ο | Ο | Ο | Ο | Ο | |
| 3月 March | 气温 Air temperature | Ο | ++ | Ο | Ο | ++ | Ο | + | ++ | ++ | ++ | ++ | ++ |
| 降水量 Precipitation | Ο | - - | Ο | Ο | Ο | Ο | Ο | - - | - - | Ο | Ο | Ο | |
| NDVI | Ο | Ο | - - | Ο | ++ | Ο | Ο | Ο | Ο | Ο | Ο | Ο | |
| 4月 April | 气温 Air temperature | Ο | ++ | Ο | Ο | Ο | Ο | + | ++ | + | ++ | ++ | ++ |
| 降水量 Precipitation | Ο | Ο | Ο | Ο | Ο | Ο | Ο | Ο | Ο | Ο | Ο | Ο | |
| NDVI | Ο | Ο | Ο | - - | Ο | + | Ο | Ο | ++ | + | ++ | Ο | |
| 5月 May | 气温 Air temperature | Ο | Ο | Ο | Ο | ++ | Ο | ++ | ++ | Ο | Ο | Ο | Ο |
| 降水量 Precipitation | Ο | - | Ο | Ο | Ο | Ο | Ο | Ο | Ο | Ο | Ο | Ο | |
| NDVI | Ο | ++ | Ο | + | + | Ο | Ο | ++ | Ο | Ο | Ο | Ο | |
| 6月 June | 气温 Air temperature | Ο | ++ | ++ | + | ++ | Ο | ++ | ++ | ++ | ++ | ++ | Ο |
| 降水量 Precipitation | Ο | Ο | Ο | Ο | Ο | Ο | Ο | Ο | Ο | Ο | Ο | + | |
| NDVI | Ο | Ο | - | - - | Ο | Ο | Ο | Ο | Ο | - | Ο | - | |
| 7月 July | 气温 Air temperature | ++ | ++ | ++ | ++ | ++ | ++ | ++ | ++ | ++ | + | ++ | Ο |
| 降水量 Precipitation | Ο | Ο | Ο | Ο | Ο | Ο | Ο | Ο | Ο | Ο | Ο | ++ | |
| NDVI | Ο | - - | Ο | - - | Ο | Ο | Ο | Ο | Ο | - | Ο | - - | |
| 8月 August | 气温 Air temperature | Ο | + | Ο | Ο | Ο | + | ++ | Ο | Ο | Ο | Ο | Ο |
| 降水量 Precipitation | - - | Ο | Ο | Ο | Ο | - | - | Ο | Ο | Ο | Ο | Ο | |
| NDVI | Ο | - | Ο | Ο | Ο | ++ | ++ | Ο | Ο | - - | - - | - - | |
| 9月 September | 气温 Air temperature | Ο | + | ++ | ++ | ++ | ++ | ++ | ++ | + | + | Ο | Ο |
| 降水量 Precipitation | Ο | Ο | - - | - - | - - | - - | - | Ο | Ο | - - | Ο | - - | |
| NDVI | + | Ο | Ο | Ο | Ο | Ο | Ο | + | Ο | Ο | Ο | - - | |
| 10月 October | 气温 Air temperature | Ο | Ο | Ο | Ο | Ο | Ο | Ο | Ο | Ο | Ο | Ο | Ο |
| 降水量 Precipitation | Ο | Ο | Ο | Ο | Ο | Ο | Ο | Ο | Ο | Ο | Ο | Ο | |
| NDVI | Ο | Ο | Ο | Ο | Ο | Ο | Ο | Ο | Ο | - | Ο | Ο | |
| 11月 November | 气温 Air temperature | Ο | + | Ο | Ο | Ο | Ο | Ο | + | Ο | Ο | Ο | ++ |
| 降水量 Precipitation | Ο | Ο | Ο | Ο | Ο | Ο | Ο | Ο | Ο | Ο | Ο | Ο | |
| NDVI | - - | Ο | Ο | Ο | Ο | Ο | Ο | Ο | Ο | Ο | Ο | Ο | |
| 12月 December | 气温 Air temperature | Ο | Ο | Ο | Ο | Ο | Ο | Ο | Ο | Ο | Ο | Ο | Ο |
| 降水量 Precipitation | Ο | Ο | Ο | Ο | Ο | Ο | Ο | Ο | Ο | Ο | Ο | Ο | |
| NDVI | - - | Ο | - | Ο | Ο | Ο | Ο | Ο | Ο | Ο | Ο | Ο | |
| 年 Annual | 气温 Air temperature | Ο | ++ | ++ | ++ | ++ | ++ | ++ | ++ | ++ | ++ | ++ | ++ |
| 降水量 Precipitation | - - | Ο | - - | Ο | - - | - - | Ο | - - | Ο | Ο | - - | Ο | |
| NDVI | Ο | - | Ο | Ο | Ο | Ο | Ο | ++ | Ο | - - | Ο | - - | |
表4 1982-2006年不同植被类型气温、降水和归一化植被指数(NDVI)的Mann-Kendall检验值
Table 4 Mann-Kendall tests of data series of air temperature, precipitation and normalized difference vegetation index (NDVI) in different vegetation types from 1982 to 2006
| 月 Month | 植被类型 Vegetation type | ||||||||||||
|---|---|---|---|---|---|---|---|---|---|---|---|---|---|
| TCTCF | TCF | TMF | TDBF | TDS | TMS | TGS | TG | STCF | STG | SDBF | SEBF | ||
| 1月 January | 气温 Air temperature | Ο | Ο | Ο | Ο | Ο | Ο | Ο | + | Ο | Ο | Ο | Ο |
| 降水 Precipitation | Ο | Ο | Ο | Ο | Ο | Ο | Ο | Ο | Ο | Ο | Ο | Ο | |
| NDVI | - | Ο | Ο | Ο | Ο | Ο | Ο | Ο | + | - | Ο | Ο | |
| 2月 February | 气温 Air temperature | Ο | ++ | ++ | ++ | ++ | + | ++ | ++ | ++ | ++ | ++ | ++ |
| 降水量 Precipitation | Ο | Ο | Ο | Ο | Ο | Ο | Ο | Ο | Ο | - | Ο | Ο | |
| NDVI | Ο | Ο | Ο | Ο | Ο | Ο | Ο | Ο | Ο | Ο | Ο | Ο | |
| 3月 March | 气温 Air temperature | Ο | ++ | Ο | Ο | ++ | Ο | + | ++ | ++ | ++ | ++ | ++ |
| 降水量 Precipitation | Ο | - - | Ο | Ο | Ο | Ο | Ο | - - | - - | Ο | Ο | Ο | |
| NDVI | Ο | Ο | - - | Ο | ++ | Ο | Ο | Ο | Ο | Ο | Ο | Ο | |
| 4月 April | 气温 Air temperature | Ο | ++ | Ο | Ο | Ο | Ο | + | ++ | + | ++ | ++ | ++ |
| 降水量 Precipitation | Ο | Ο | Ο | Ο | Ο | Ο | Ο | Ο | Ο | Ο | Ο | Ο | |
| NDVI | Ο | Ο | Ο | - - | Ο | + | Ο | Ο | ++ | + | ++ | Ο | |
| 5月 May | 气温 Air temperature | Ο | Ο | Ο | Ο | ++ | Ο | ++ | ++ | Ο | Ο | Ο | Ο |
| 降水量 Precipitation | Ο | - | Ο | Ο | Ο | Ο | Ο | Ο | Ο | Ο | Ο | Ο | |
| NDVI | Ο | ++ | Ο | + | + | Ο | Ο | ++ | Ο | Ο | Ο | Ο | |
| 6月 June | 气温 Air temperature | Ο | ++ | ++ | + | ++ | Ο | ++ | ++ | ++ | ++ | ++ | Ο |
| 降水量 Precipitation | Ο | Ο | Ο | Ο | Ο | Ο | Ο | Ο | Ο | Ο | Ο | + | |
| NDVI | Ο | Ο | - | - - | Ο | Ο | Ο | Ο | Ο | - | Ο | - | |
| 7月 July | 气温 Air temperature | ++ | ++ | ++ | ++ | ++ | ++ | ++ | ++ | ++ | + | ++ | Ο |
| 降水量 Precipitation | Ο | Ο | Ο | Ο | Ο | Ο | Ο | Ο | Ο | Ο | Ο | ++ | |
| NDVI | Ο | - - | Ο | - - | Ο | Ο | Ο | Ο | Ο | - | Ο | - - | |
| 8月 August | 气温 Air temperature | Ο | + | Ο | Ο | Ο | + | ++ | Ο | Ο | Ο | Ο | Ο |
| 降水量 Precipitation | - - | Ο | Ο | Ο | Ο | - | - | Ο | Ο | Ο | Ο | Ο | |
| NDVI | Ο | - | Ο | Ο | Ο | ++ | ++ | Ο | Ο | - - | - - | - - | |
| 9月 September | 气温 Air temperature | Ο | + | ++ | ++ | ++ | ++ | ++ | ++ | + | + | Ο | Ο |
| 降水量 Precipitation | Ο | Ο | - - | - - | - - | - - | - | Ο | Ο | - - | Ο | - - | |
| NDVI | + | Ο | Ο | Ο | Ο | Ο | Ο | + | Ο | Ο | Ο | - - | |
| 10月 October | 气温 Air temperature | Ο | Ο | Ο | Ο | Ο | Ο | Ο | Ο | Ο | Ο | Ο | Ο |
| 降水量 Precipitation | Ο | Ο | Ο | Ο | Ο | Ο | Ο | Ο | Ο | Ο | Ο | Ο | |
| NDVI | Ο | Ο | Ο | Ο | Ο | Ο | Ο | Ο | Ο | - | Ο | Ο | |
| 11月 November | 气温 Air temperature | Ο | + | Ο | Ο | Ο | Ο | Ο | + | Ο | Ο | Ο | ++ |
| 降水量 Precipitation | Ο | Ο | Ο | Ο | Ο | Ο | Ο | Ο | Ο | Ο | Ο | Ο | |
| NDVI | - - | Ο | Ο | Ο | Ο | Ο | Ο | Ο | Ο | Ο | Ο | Ο | |
| 12月 December | 气温 Air temperature | Ο | Ο | Ο | Ο | Ο | Ο | Ο | Ο | Ο | Ο | Ο | Ο |
| 降水量 Precipitation | Ο | Ο | Ο | Ο | Ο | Ο | Ο | Ο | Ο | Ο | Ο | Ο | |
| NDVI | - - | Ο | - | Ο | Ο | Ο | Ο | Ο | Ο | Ο | Ο | Ο | |
| 年 Annual | 气温 Air temperature | Ο | ++ | ++ | ++ | ++ | ++ | ++ | ++ | ++ | ++ | ++ | ++ |
| 降水量 Precipitation | - - | Ο | - - | Ο | - - | - - | Ο | - - | Ο | Ο | - - | Ο | |
| NDVI | Ο | - | Ο | Ο | Ο | Ο | Ο | ++ | Ο | - - | Ο | - - | |
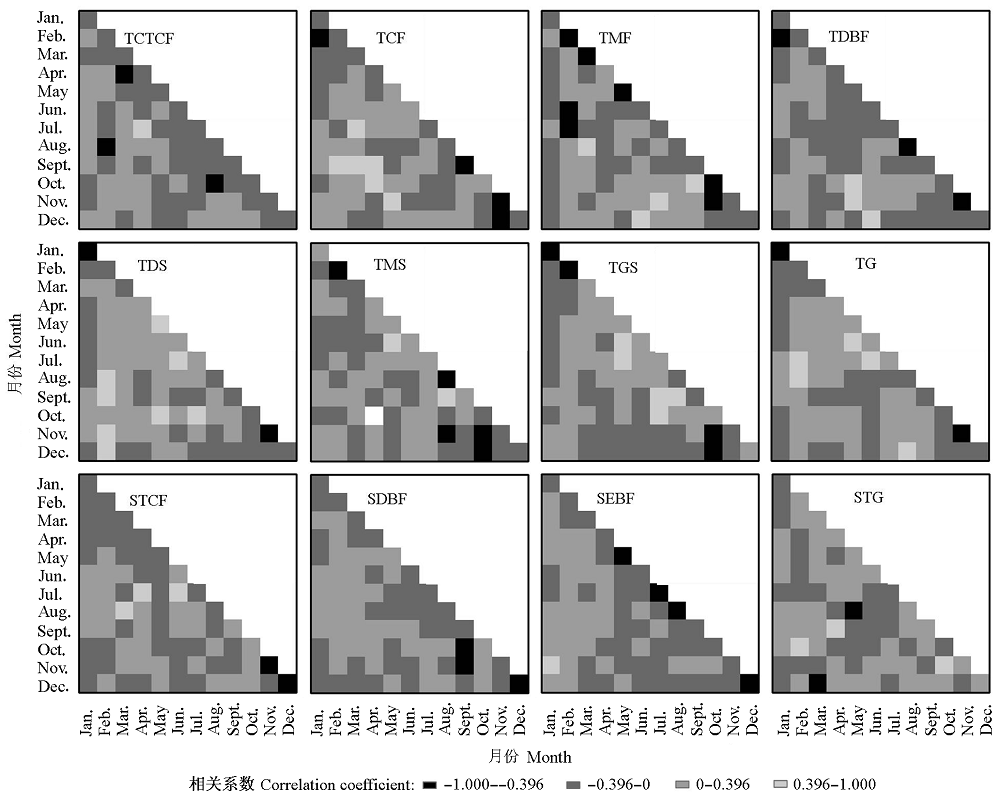
图5 中国东部南北样带各植被类型不同月份归一化植被指数与降水的相关关系。缩写同表1。
Fig. 5 Correlation coefficients between normalized difference vegetation index and precipitation in different months and vegetation types in North-South Transect of Eastern China. Abbreviations are the same as in Table 1.
| [1] | Botta A, Viovy N, Ciais P, Friedlingstein P, Monfray P (2000). A global prognostic scheme of leaf onset using satellite data. Global Change Biology, 6,709-725. |
| [2] | Cui LL (崔林丽), Shi J (史军), Yang YM (杨引明), Fan WY (范文义) (2009). Ten-day response of vegetation NDVI to the variations of temperature and precipitation in Eastern China. Acta Geographic Sinica(地理学报), 64,850-860. (in Chinese with English abstract) |
| [3] | de Beurs KM, Henebry GM (2004). Trend analysis of the pathfinder AVHRR Land (PAL) NDVI data for the deserts of central Asia. IEEE Geoscience and Remote Sensing Letters, 1,282-286. |
| [4] | de Beurs KM, Henebry GM (2005). A statistical framework for the analysis of long image time series. International Journal of Remote Sensing, 26,1551-1573. |
| [5] | Gao Q, Li XB, Yang XS (2003). Responses of vegetation and primary production in North-South Transect of Eastern China to global change under land use constraint. Acta Botanica Sinica, 45,1274-1284. |
| [6] | Goward SN, Tucker CJ, Dye DG (1985). North American vegetation patterns observed with the NOAA-7 advanced very high resolution radiometer. Plant Ecology, 64,3-14. |
| [7] | Hirsch RM, Slack JR, Smith RA (1982). Techniques of trend analysis for monthly water quality data. Water Resources Research, 18,107-121. |
| [8] | Hou XY (侯学煜) (2001). Vegetation Atlas of China (1:1 000 000) (1:1 000 000中国植被图集). Science Press, Beijing. (in Chinese) |
| [9] |
Kendall MG (1975). Rank Correlation Methods. Charles Griffin, London.
URL PMID |
| [10] | Lettenmaier DP (1988). Multivariate nonparametric tests for trend in water quality. Water Resources Bulletin, 24,505-512. |
| [11] | Libiseller C, Grimvall A (2002). Performance of partial Mann-Kendall tests for trend detection in the presence of covariates. Environmetrics, 13,71-84. |
| [12] | Li Y (李岩), Liao SD (廖圣东), Chi GB (迟国彬), Liao QF (廖其芳) (2004). Spatial distribution NPP in forest and crop along North-South Transect of Eastern China. Chinese Science Bulletin(科学通报), 49,679-685. (in Chinese) |
| [13] | Mann HB (1945). Nonparametric tests against trend. Econo- metrica, 13,245-259. |
| [14] | McVicar TR, Bierwirth PN (2001). Rapidly assessing the 1997 drought in Papua New Guinea using composite AVHRR imagery. International Journal of Remote Sensing, 22,2109-2128. |
| [15] | McVicar TR, van Niel TG, Li LT, Hutchinson MF, Mu XM, Liu ZH (2007). Spatially distributing monthly reference evapotranspiration and pan evaporation considering topo- graphic influences. Journal of Hydrology, 338,196-220. |
| [16] | Peng SL (彭少麟), Zhao P (赵平), Ren H (任海), Zheng FY (郑凤英) (2002). The possible heat-driven pattern variation of zonal vegetation and agricultural ecosystems along the North-South Transect of China under the global change. Earth Science Frontiers(地学前缘), 9,217-226. (in Chinese with English abstract) |
| [17] | Piao SL, Fang JY, Ji W, Guo QH, Ke JH, Tao S (2004). Variation in a satellite-based vegetation index in relation to climate in China. Journal of Vegetation Science, 15,219-226. |
| [18] | Piao SL, Fang JY, Zhou LM, Guo QH, Henderson M, Ji W, Li Y, Tao S (2003). Interannual variations of monthly and seasonal normalized difference vegetation index NDVI in China from 1982 to 1999. Journal of Geophysical Research, 108,1-13. |
| [19] | Schultz PA, Halpert MS (1995). Global analysis of the relationships among a vegetation index, precipitation and land surface temperature. International Journal of Remote Sensing, 16,2755-2777. |
| [20] | Sun PS, Grignetti A, Liu SR, Casacchia R, Salvatori R, Pietrini F, Loreto F, Centritto M (2008a). Associated changes in physiological parameters and spectral reflectance indices in olive ( Olea europaea L.) leaves in response to different levels of water stress. International Journal of Remote Sensing, 29,1725-1743. |
| [21] | Sun PS, Liu SR, Jiang H, Liu YL, Liu JT, Lin Y, Liu XL (2008b). Hydrologic effects of NDVI time series in a context of climatic variability in an upstream catchment of the Minjiang River. Journal of the American Water Resources Association, 44,1132-1143. |
| [22] | Teng L (滕菱), Ren H (任海), Peng SL (彭少麟) (2000). The natural situation of North South Transect of Eastern China. Ecologic Science(生态科学), 19(4),1-10. (in Chinese with English abstract) |
| [23] | Tucker CJ, Pinzon JE, Brown ME, Slayback DA, Pak EW, Mahoney R, Vermote EF, Saleous NE (2005). An extended AVHRR 8-km NDVI dataset compatible with MODIS and SPOT vegetation NDVI data. International Journal of Remote Sensing, 26,4485-4498. |
| [24] | Wang ZM (王宗明), Guo ZX (国志兴), Song KS (宋开山), Luo L (罗玲), Zhang B (张柏), Liu DW (刘殿伟), Huang N (黄妮), Ren CY (任春颖) (2009). Responses of vegeta- tion NDVI in Northeast China to climate change. Chinese Journal of Ecology(生态学杂志), 28,1041-1048. (in Chinese with English abstract) |
| [25] | Yu Z (余振), Sun PS (孙鹏森), Liu SR (刘世荣) (2010). Phenological change of main vegetation types along a North-South Transect of Eastern China. Chinese Journal of Plant Ecology(植物生态学报), 34,316-329. (in Chinese with English abstract) |
| [26] | Zhou GS (周广胜) (1999). Impact of climate change on NPP of agriculture and animal husbandry in ecologically vuln- erable areas: mechanism and modelling. Resources Science (资源科学), 21(5),46-52. (in Chinese with English abstract) |
| [1] | 陈以恒 玉素甫江·如素力 阿卜杜热合曼·吾斯曼. 2001-2020年天山新疆段草地植被覆盖度时空变化及驱动因素分析[J]. 植物生态学报, 2024, 48(5): 561-576. |
| [2] | 张计深, 史新杰, 刘宇诺, 吴阳, 彭守璋. 气候变化下中国潜在自然植被生态系统碳储量动态[J]. 植物生态学报, 2024, 48(4): 428-444. |
| [3] | 臧妙涵, 王传宽, 梁逸娴, 刘逸潇, 上官虹玉, 全先奎. 基于纬度移栽的落叶松叶、枝、根生态化学计量特征对气候变暖的响应[J]. 植物生态学报, 2024, 48(4): 469-482. |
| [4] | 梁逸娴, 王传宽, 臧妙涵, 上官虹玉, 刘逸潇, 全先奎. 落叶松径向生长和生物量分配对气候变暖的响应[J]. 植物生态学报, 2024, 48(4): 459-468. |
| [5] | 吴茹茹, 刘美珍, 谷仙, 常馨月, 郭立月, 蒋高明, 祁如意. 气候变化对巨柏适宜生境分布的潜在影响和预测[J]. 植物生态学报, 2024, 48(4): 445-458. |
| [6] | 杨宇萌, 来全, 刘心怡. 气候变化和人类活动对内蒙古植被总初级生产力的定量影响[J]. 植物生态学报, 2024, 48(3): 306-316. |
| [7] | 张启, 程雪寒, 王树芝. 北京西山老龄树记载的森林干扰历史[J]. 植物生态学报, 2024, 48(3): 341-348. |
| [8] | 冯珊珊, 黄春晖, 唐梦云, 蒋维昕, 白天道. 细叶云南松针叶形态和显微性状地理变异及其环境解释[J]. 植物生态学报, 2023, 47(8): 1116-1130. |
| [9] | 任培鑫, 李鹏, 彭长辉, 周晓路, 杨铭霞. 洞庭湖流域植被光合物候的时空变化及其对气候变化的响应[J]. 植物生态学报, 2023, 47(3): 319-330. |
| [10] | 李杰, 郝珉辉, 范春雨, 张春雨, 赵秀海. 东北温带森林树种和功能多样性对生态系统多功能性的影响[J]. 植物生态学报, 2023, 47(11): 1507-1522. |
| [11] | 魏瑶, 马志远, 周佳颖, 张振华. 模拟增温改变青藏高原植物繁殖物候及植株高度[J]. 植物生态学报, 2022, 46(9): 995-1004. |
| [12] | 党宏忠, 张学利, 韩辉, 石长春, 葛玉祥, 马全林, 陈帅, 刘春颖. 樟子松固沙林林水关系研究进展及对营林实践的指导[J]. 植物生态学报, 2022, 46(9): 971-983. |
| [13] | 李肖, PIALUANG Bounthong, 康文辉, 冀晓东, 张海江, 薛治国, 张志强. 近几十年来冀西北山地白桦次生林径向生长对气候变化的响应[J]. 植物生态学报, 2022, 46(8): 919-931. |
| [14] | 苏启陶, 杜志喧, 周兵, 廖永辉, 王呈呈, 肖宜安. 牯岭凤仙花及其传粉昆虫在中国的潜在分布区域分析[J]. 植物生态学报, 2022, 46(7): 785-796. |
| [15] | 胡潇飞, 魏临风, 程琦, 吴星麒, 倪健. 青藏高原地区气候图解数据集[J]. 植物生态学报, 2022, 46(4): 484-492. |
| 阅读次数 | ||||||
|
全文 |
|
|||||
|
摘要 |
|
|||||
Copyright © 2026 版权所有 《植物生态学报》编辑部
地址: 北京香山南辛村20号, 邮编: 100093
Tel.: 010-62836134, 62836138; Fax: 010-82599431; E-mail: apes@ibcas.ac.cn, cjpe@ibcas.ac.cn
备案号: 京ICP备16067583号-19
![]()