
植物生态学报 ›› 2006, Vol. 30 ›› Issue (1): 147-156.DOI: 10.17521/cjpe.2006.0021 cstr: 32100.14.cjpe.2006.0021
王英, 康明, 黄宏文*( )
)
收稿日期:2005-01-06
接受日期:2005-04-10
出版日期:2006-01-06
发布日期:2006-01-30
作者简介:*E-mail:hongwen@wbgcas.cn基金资助:
WANG Ying, KANG Ming, HUANG Hong-Wen*()
Received:2005-01-06
Accepted:2005-04-10
Online:2006-01-06
Published:2006-01-30
摘要:
采用微卫星标记对茅栗(Castanea sequinii)随机大居群以及其中各亚居群的遗传结构进行了空间自相关分析,以探讨植物自然居群内遗传变异的分布特征及其形成机制。通过9对微卫星引物所产生的119个多态位点,测定了大别山区域内茅栗居群以及各亚居群的空间自相关系数Moran's I值。结果表明:大别山分布的野生茅栗为一个缺乏空间结构的随机大居群,茅栗亚居群之间频繁的花粉流削弱了地理隔离导致的遗传漂变或分化作用在维系居群随机遗传结构中具有的重要作用。但是,在接近亚居群大小的地域范围内(0.228 km)具有一定的空间结构,即小地域尺度中的亚居群存在着空间遗传结构。取样的3个亚居群在小格局范围内都存在一定的空间结构,遗传变异基本上呈非随机分布,在短距离内(61 m)3个亚居群一致表现出不同程度的显著正相关,而随着距离的增加,Moran's I值虽然在不同亚居群间存在一定差异变化,但是总体而言趋向预期值,即不存在空间结构,说明其遗传变异在亚居群内只是在短距离内形成一定的空间结构。研究认为有限的种子散播以及微生境选择等因素可能是产生这种小格局的遗传结构的主要原因。上述研究结果有助于进一步了解植物随机大居群的进化历史和生态过程,同时也为栗属植物中国特有种的保育策略提供了科学依据。
王英, 康明, 黄宏文. 用分子标记揭示植物随机大居群中亚居群的遗传结构——茅栗自然居群空间遗传结构的SSR分析. 植物生态学报, 2006, 30(1): 147-156. DOI: 10.17521/cjpe.2006.0021
WANG Ying, KANG Ming, HUANG Hong-Wen. SUBPOPULATION GENETIC STRUCTURE IN A PANMICTIC POPULATION AS REVEALED BY MOLECULAR MARKERS: A CASE STUDY OF CASTANEA SEQUINII USING SSR MARKERS. Chinese Journal of Plant Ecology, 2006, 30(1): 147-156. DOI: 10.17521/cjpe.2006.0021
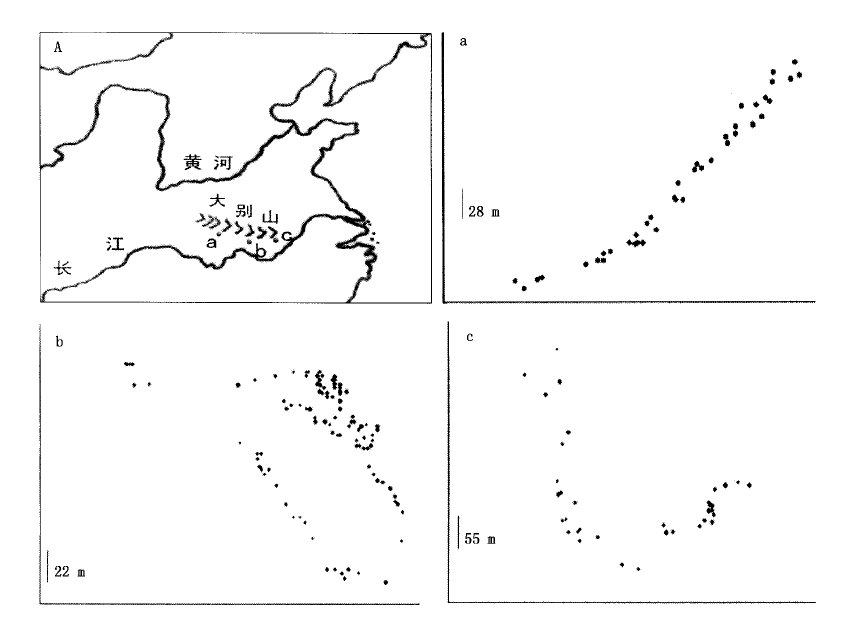
图1 3个亚居群的取样示意图(A)及每个亚居群内的个体位置图 a.广水Guangshui b.麻城Macheng c.岳西Yuexi
Fig.1 The sketch map of 3 subpopulations of C. sequinii in China (A) and spatial distribution of individuals within each subpopulation
| 引物编号 Locus code | 片段大小范围 Size range (bp) | 等位基因数 No.of alleles | 预期杂合度 He | 观察杂合度 Ho | 近交系数 FIS | 居群分化系数 FST | 哈迪-温格平衡检验 Hardy-weinberg equilibrium test |
|---|---|---|---|---|---|---|---|
| CsCAT1 | 160~201 | 19 | 0.879 | 0.538 | 0.359 | 0.094 | NS |
| CsCAT2 | 180~226 | 13 | 0.864 | 0.774 | 0.034 | 0.078 | NS |
| CsCAT3 | 197~215 | 6 | 0.637 | 0.594 | -0.023 | 0.089 | NS |
| CsCAT4 | 217~261 | 13 | 0.818 | 0.817 | -0.047 | 0.054 | NS |
| CsCAT5 | 217~242 | 7 | 0.753 | 0.607 | 0.181 | 0.031 | NS |
| CsCAT7 | 190~217 | 6 | 0.761 | 0.538 | 0.256 | 0.038 | NS |
| CsCAT8 | 190~210 | 6 | 0.729 | 0.658 | 0.117 | 0.018 | NS |
| CsCAT14 | 150~160 | 6 | 0.754 | 0.770 | -0.151 | 0.049 | NS |
| CsCAT15 | 127~142 | 12 | 0.790 | 0.355 | 0.436 | 0.119 | NS |
| 平均值Mean | 9.78 | 0.778 | 0.625 | 0.129 | 0.063 | NS |
表1 9对栗属植物微卫星引物所得片段大小范围,遗传多样性和遗传分化参数以及Hardy-weinberg平衡检验
Table 1 List of 9 primers used and size range, genetic diversity and genetic differentiation parameters, and Hardy-weinberg equilibrium test
| 引物编号 Locus code | 片段大小范围 Size range (bp) | 等位基因数 No.of alleles | 预期杂合度 He | 观察杂合度 Ho | 近交系数 FIS | 居群分化系数 FST | 哈迪-温格平衡检验 Hardy-weinberg equilibrium test |
|---|---|---|---|---|---|---|---|
| CsCAT1 | 160~201 | 19 | 0.879 | 0.538 | 0.359 | 0.094 | NS |
| CsCAT2 | 180~226 | 13 | 0.864 | 0.774 | 0.034 | 0.078 | NS |
| CsCAT3 | 197~215 | 6 | 0.637 | 0.594 | -0.023 | 0.089 | NS |
| CsCAT4 | 217~261 | 13 | 0.818 | 0.817 | -0.047 | 0.054 | NS |
| CsCAT5 | 217~242 | 7 | 0.753 | 0.607 | 0.181 | 0.031 | NS |
| CsCAT7 | 190~217 | 6 | 0.761 | 0.538 | 0.256 | 0.038 | NS |
| CsCAT8 | 190~210 | 6 | 0.729 | 0.658 | 0.117 | 0.018 | NS |
| CsCAT14 | 150~160 | 6 | 0.754 | 0.770 | -0.151 | 0.049 | NS |
| CsCAT15 | 127~142 | 12 | 0.790 | 0.355 | 0.436 | 0.119 | NS |
| 平均值Mean | 9.78 | 0.778 | 0.625 | 0.129 | 0.063 | NS |
| 居群 Population | 平均等位 基因数A | 平均有效等位 基因数Ae | 预期杂合度 He | 观察杂合度 Ho | 特有等位 基因数Ape | 近交系数 FIS | 取样个体数 Sampling size | ||||||||||||||||
|---|---|---|---|---|---|---|---|---|---|---|---|---|---|---|---|---|---|---|---|---|---|---|---|
| 随机大居群 Panmictric population | 9.778(1.561 5) | 4.954(0.595 8) | 0.776(0.024 4) | 0.625 | 0.190 | 197 | |||||||||||||||||
| 广水 Guangshui | 6.111(0.696 1) | 3.578(0.332 9) | 0.705(0.021 4) | 0.634 | 3 | 0.109 | 43 | ||||||||||||||||
| 麻城 Macheng | 8.444(1.168 0) | 4.537(0.556 7) | 0.750(0.033 9) | 0.620 | 20 | 0.169 | 118 | ||||||||||||||||
| 岳西 Yuexi | 6.000(0.500 0) | 3.638(0.330 7) | 0.704(0.030 2) | 0.622 | 6 | 0.104 | 36 | ||||||||||||||||
表2 茅栗随机大居群及其3个亚居群取样及遗传多样性参数
Table 2 The genetic diversity parameters of large panmictic population and three subpopulations of Castanea sequnii sampled
| 居群 Population | 平均等位 基因数A | 平均有效等位 基因数Ae | 预期杂合度 He | 观察杂合度 Ho | 特有等位 基因数Ape | 近交系数 FIS | 取样个体数 Sampling size | ||||||||||||||||
|---|---|---|---|---|---|---|---|---|---|---|---|---|---|---|---|---|---|---|---|---|---|---|---|
| 随机大居群 Panmictric population | 9.778(1.561 5) | 4.954(0.595 8) | 0.776(0.024 4) | 0.625 | 0.190 | 197 | |||||||||||||||||
| 广水 Guangshui | 6.111(0.696 1) | 3.578(0.332 9) | 0.705(0.021 4) | 0.634 | 3 | 0.109 | 43 | ||||||||||||||||
| 麻城 Macheng | 8.444(1.168 0) | 4.537(0.556 7) | 0.750(0.033 9) | 0.620 | 20 | 0.169 | 118 | ||||||||||||||||
| 岳西 Yuexi | 6.000(0.500 0) | 3.638(0.330 7) | 0.704(0.030 2) | 0.622 | 6 | 0.104 | 36 | ||||||||||||||||
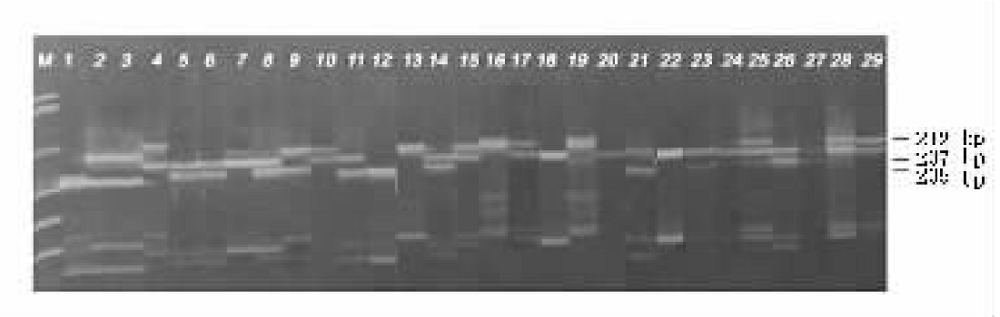
图2 引物CsCAT1在茅栗居群中扩增出的多态谱带
Fig.2 Microsatellite polymorphism in the population of Castanea squinii with SsrCsCAT1
| 位点 Locus | 10个距离等级(km)的Moran's I值 Moran's I for 10 distance classes (km) | 累积机率 Cum. Prob | |||||||||
|---|---|---|---|---|---|---|---|---|---|---|---|
| 1 | 2 | 3 | 4 | 5 | 6 | 7 | 8 | 9 | 10 | ||
| CsCAT1-180 | 0.32** | 0.26** | 0.31** | 0.16** | -0.03 | -0.13** | -0.15** | -0.55** | -0.57** | 0.15** | 0.000* |
| CsCAT1-188 | 0.01 | 0.02 | -0.02 | -0.07 | 0.02 | -0.02 | -0.00 | -0.00 | -0.01 | 0.01 | 0.045* |
| CsCAT1-190 | 0.07** | -0.09** | 0.04* | -0.06** | -0.04* | 0.01 | 0.00 | -0.02 | 0.03 | -0.02 | 0.001* |
| CsCAT2-209 | 0.15** | 0.05** | 0.06** | -0.01 | -0.23** | -0.13** | 0.02 | -0.01 | 0.17** | -0.11** | 0.000* |
| CsCAT3-201 | 0.09** | -0.02 | 0.03 | -0.04 | -0.17** | 0.04* | -0.00 | 0.01 | 0.05* | -0.04 | 0.000* |
| CsCAT3-207 | 0.04** | 0.01 | -0.01 | 0.01 | 0.07** | -0.00 | 0.05** | -0.04* | -0.08** | -0.13** | 0.000* |
| CsCAT4-230 | 0.06** | 0.04* | -0.02 | 0.02 | -0.00 | -0.03 | -0.12** | -0.02 | -0.03 | 0.04** | 0.000* |
| CsCAT4-238 | 0.10** | 0.05** | -0.07** | -0.03 | 0.02 | 0.04** | 0.04* | -0.11** | -0.03 | -0.08** | 0.000* |
| CsCAT4-242 | 0.07** | 0.08** | 0.01 | 0.15** | 0.00 | -0.11** | -0.20** | -0.07** | -0.11** | 0.11** | 0.000* |
| CsCAT4-253 | 0.05** | -0.05* | -0.01 | -0.05* | -0.01 | 0.01 | 0.01 | -0.02 | -0.00 | -0.00 | 0.056 |
| CsCAT5-227 | 0.04** | -0.03 | 0.02 | -0.01 | 0.01 | -0.03 | -0.06** | -0.01 | -0.04 | 0.04* | 0.037* |
| CsCAT5-232 | 0.12** | 0.07** | 0.07** | 0.04* | 0.07** | -0.01 | -0.05* | -0.20** | -0.13** | -0.11** | 0.000* |
| CsCAT7-205 | 0.16** | 0.08** | -0.08** | 0.00 | -0.06** | 0.01 | -0.08** | -0.18** | 0.00 | 0.09** | 0.000* |
| CsCAT7-209 | 0.05** | 0.05* | -0.04* | -0.01 | -0.08** | 0.02 | 0.00 | -0.08** | -0.01 | 0.05** | 0.000* |
| CsCAT7-215 | 0.02 | -0.03 | -0.03 | 0.02 | -0.02 | 0.02 | -0.03 | 0.01 | -0.01 | 0.00 | 1.000 |
| CsCAT7-217 | -0.00 | -0.02 | 0.02 | 0.00 | 0.02 | -0.00 | 0.03 | -0.01 | -0.03 | -0.07* | 0.176 |
| CsCAT8-190 | 0.02 | -0.02 | 0.01 | -0.01 | -0.03 | -0.05 | 0.02 | -0.01 | -0.02 | 0.02 | 0.780 |
| CsCAT8-201 | 0.02 | 0.04* | 0.04* | 0.02 | -0.05 | -0.03 | 0.05* | -0.05 | -0.11** | -0.00 | 0.001* |
| CsCAT8-204 | -0.04 | 0.03 | -0.02 | -0.01 | 0.01 | -0.03 | 0.01 | -0.01 | 0.00 | -0.01 | 0.798 |
| CsCAT8-207 | 0.04* | 0.01 | -0.00 | 0.05** | -0.04* | -0.02 | 0.04** | -0.07** | -0.09** | 0.01 | 0.000* |
| CsCAT14-150 | -0.02 | 0.00 | -0.01 | -0.03 | 0.03* | -0.03 | 0.02 | -0.01 | 0.00 | -0.00 | 0.400 |
| CsCAT14-153 | 0.03* | 0.01 | -0.01 | 0.05** | 0.03* | -0.04 | -0.05* | -0.01 | 0.02 | -0.10** | 0.000* |
| CsCAT14-155 | 0.14** | -0.01 | 0.05** | 0.19** | 0.07** | -0.12** | -0.11** | -0.02 | 0.09** | -0.41** | 0.000* |
| CsCAT14-157 | 0.10** | 0.08** | 0.14** | 0.11** | -0.13** | -0.26** | -0.08** | -0.02 | -0.02 | 0.02 | 0.000* |
| CsCAT15-133 | 0.19** | 0.16** | -0.01 | -0.04 | -0.16** | -0.15** | -0.04 | 0.09** | 0.01 | -0.09** | 0.000* |
| CsCAT15-134 | 0.16** | 0.11** | 0.09** | 0.12** | 0.04* | -0.00 | -0.12** | -0.28** | -0.06** | -0.08** | 0.000* |
| CsCAT15-135 | 0.02 | 0.02 | 0.05* | -0.00 | -0.06** | -0.06** | -0.02 | -0.02 | -0.05* | 0.06** | 0.022* |
| 平均Average | 0.08 | 0.03 | 0.02 | 0.02 | -0.03 | -0.04 | -0.03 | -0.06 | -0.04 | -0.03 | - |
| 最大值Maximum | 0.32 | 0.26 | 0.31 | 0.19 | 0.07 | 0.04 | 0.05 | 0.09 | 0.17 | 0.15 | - |
| 最小值Minimum | -0.04 | -0.09 | -0.08 | -0.07 | -0.23 | -0.26 | -0.20 | -0.55 | -0.57 | -0.41 | - |
表3 茅栗随机大居群10个距离等级下的Moran's I值及其显著值
Table 3 Spatial autocorrelation coefficients (Moran's I) for 10 distance classes in panmictic population of Castanea squinii
| 位点 Locus | 10个距离等级(km)的Moran's I值 Moran's I for 10 distance classes (km) | 累积机率 Cum. Prob | |||||||||
|---|---|---|---|---|---|---|---|---|---|---|---|
| 1 | 2 | 3 | 4 | 5 | 6 | 7 | 8 | 9 | 10 | ||
| CsCAT1-180 | 0.32** | 0.26** | 0.31** | 0.16** | -0.03 | -0.13** | -0.15** | -0.55** | -0.57** | 0.15** | 0.000* |
| CsCAT1-188 | 0.01 | 0.02 | -0.02 | -0.07 | 0.02 | -0.02 | -0.00 | -0.00 | -0.01 | 0.01 | 0.045* |
| CsCAT1-190 | 0.07** | -0.09** | 0.04* | -0.06** | -0.04* | 0.01 | 0.00 | -0.02 | 0.03 | -0.02 | 0.001* |
| CsCAT2-209 | 0.15** | 0.05** | 0.06** | -0.01 | -0.23** | -0.13** | 0.02 | -0.01 | 0.17** | -0.11** | 0.000* |
| CsCAT3-201 | 0.09** | -0.02 | 0.03 | -0.04 | -0.17** | 0.04* | -0.00 | 0.01 | 0.05* | -0.04 | 0.000* |
| CsCAT3-207 | 0.04** | 0.01 | -0.01 | 0.01 | 0.07** | -0.00 | 0.05** | -0.04* | -0.08** | -0.13** | 0.000* |
| CsCAT4-230 | 0.06** | 0.04* | -0.02 | 0.02 | -0.00 | -0.03 | -0.12** | -0.02 | -0.03 | 0.04** | 0.000* |
| CsCAT4-238 | 0.10** | 0.05** | -0.07** | -0.03 | 0.02 | 0.04** | 0.04* | -0.11** | -0.03 | -0.08** | 0.000* |
| CsCAT4-242 | 0.07** | 0.08** | 0.01 | 0.15** | 0.00 | -0.11** | -0.20** | -0.07** | -0.11** | 0.11** | 0.000* |
| CsCAT4-253 | 0.05** | -0.05* | -0.01 | -0.05* | -0.01 | 0.01 | 0.01 | -0.02 | -0.00 | -0.00 | 0.056 |
| CsCAT5-227 | 0.04** | -0.03 | 0.02 | -0.01 | 0.01 | -0.03 | -0.06** | -0.01 | -0.04 | 0.04* | 0.037* |
| CsCAT5-232 | 0.12** | 0.07** | 0.07** | 0.04* | 0.07** | -0.01 | -0.05* | -0.20** | -0.13** | -0.11** | 0.000* |
| CsCAT7-205 | 0.16** | 0.08** | -0.08** | 0.00 | -0.06** | 0.01 | -0.08** | -0.18** | 0.00 | 0.09** | 0.000* |
| CsCAT7-209 | 0.05** | 0.05* | -0.04* | -0.01 | -0.08** | 0.02 | 0.00 | -0.08** | -0.01 | 0.05** | 0.000* |
| CsCAT7-215 | 0.02 | -0.03 | -0.03 | 0.02 | -0.02 | 0.02 | -0.03 | 0.01 | -0.01 | 0.00 | 1.000 |
| CsCAT7-217 | -0.00 | -0.02 | 0.02 | 0.00 | 0.02 | -0.00 | 0.03 | -0.01 | -0.03 | -0.07* | 0.176 |
| CsCAT8-190 | 0.02 | -0.02 | 0.01 | -0.01 | -0.03 | -0.05 | 0.02 | -0.01 | -0.02 | 0.02 | 0.780 |
| CsCAT8-201 | 0.02 | 0.04* | 0.04* | 0.02 | -0.05 | -0.03 | 0.05* | -0.05 | -0.11** | -0.00 | 0.001* |
| CsCAT8-204 | -0.04 | 0.03 | -0.02 | -0.01 | 0.01 | -0.03 | 0.01 | -0.01 | 0.00 | -0.01 | 0.798 |
| CsCAT8-207 | 0.04* | 0.01 | -0.00 | 0.05** | -0.04* | -0.02 | 0.04** | -0.07** | -0.09** | 0.01 | 0.000* |
| CsCAT14-150 | -0.02 | 0.00 | -0.01 | -0.03 | 0.03* | -0.03 | 0.02 | -0.01 | 0.00 | -0.00 | 0.400 |
| CsCAT14-153 | 0.03* | 0.01 | -0.01 | 0.05** | 0.03* | -0.04 | -0.05* | -0.01 | 0.02 | -0.10** | 0.000* |
| CsCAT14-155 | 0.14** | -0.01 | 0.05** | 0.19** | 0.07** | -0.12** | -0.11** | -0.02 | 0.09** | -0.41** | 0.000* |
| CsCAT14-157 | 0.10** | 0.08** | 0.14** | 0.11** | -0.13** | -0.26** | -0.08** | -0.02 | -0.02 | 0.02 | 0.000* |
| CsCAT15-133 | 0.19** | 0.16** | -0.01 | -0.04 | -0.16** | -0.15** | -0.04 | 0.09** | 0.01 | -0.09** | 0.000* |
| CsCAT15-134 | 0.16** | 0.11** | 0.09** | 0.12** | 0.04* | -0.00 | -0.12** | -0.28** | -0.06** | -0.08** | 0.000* |
| CsCAT15-135 | 0.02 | 0.02 | 0.05* | -0.00 | -0.06** | -0.06** | -0.02 | -0.02 | -0.05* | 0.06** | 0.022* |
| 平均Average | 0.08 | 0.03 | 0.02 | 0.02 | -0.03 | -0.04 | -0.03 | -0.06 | -0.04 | -0.03 | - |
| 最大值Maximum | 0.32 | 0.26 | 0.31 | 0.19 | 0.07 | 0.04 | 0.05 | 0.09 | 0.17 | 0.15 | - |
| 最小值Minimum | -0.04 | -0.09 | -0.08 | -0.07 | -0.23 | -0.26 | -0.20 | -0.55 | -0.57 | -0.41 | - |
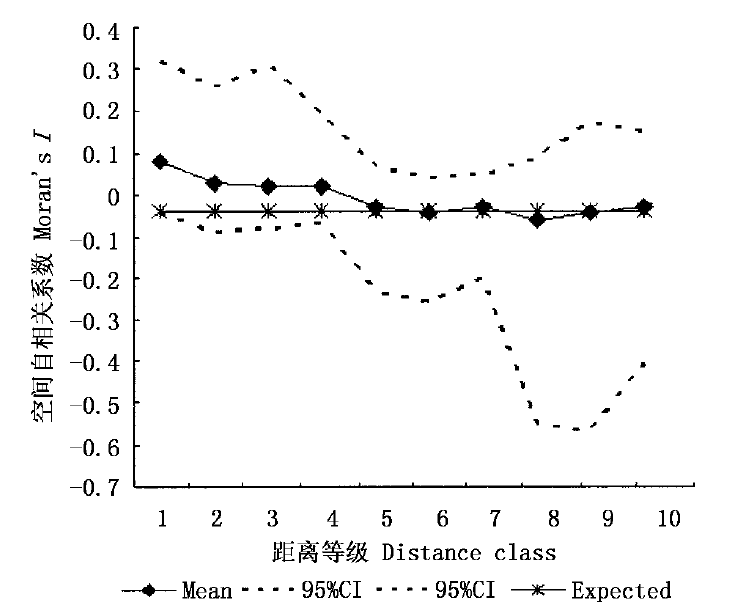
图3 依据9个微卫星位点随机大居群在10个距离等级上的Moran's I平均值得出的自相关图(95%CI: 95%的置信间)
Fig.3 Correlogram using mean value of Moran's I at 9 Microsatellite loci and 10 distance intervals in panmictic population (95%CI: 95% confidence interval)

图4 依据9个微卫星位点3个亚居群的自相关图:广水(a)和麻城(b)亚居群在9个距离等级、岳西(c)亚居群在10个距离等级上的Moran's I平均值得出的自相关图(95%CI: 95%的置信区间)
Fig.4 The correlogram of 3 subpopulations using mean value of Moran's I at 9 Microsatellite loci: 9 distance intervals in Guangshui(a) and Macheng(b) subpopulation, 10 distance intervals in Yuexi(c) subpopulation (95%CI: 95% confidence interval)
| [1] |
Asuka Y, Tomaru N, Nisimura N, Tsumura Y, Yamamoto S (2004). Heterogeneous genetic structure in a Fagus crenata population in an old-growth beech forest revealed by microsatellite markers. Molecular Ecology, 13,1241-1250.
URL PMID |
| [2] | Ausubel FM, Brent R, Kingston RE, Moore DD, Seidman JG, Smith JA, Stuhl K (1987). Current Protocols in Molecular Biology. John Wiley & Sons, New York. |
| [3] | Bjornstad ON, Falck W, Stenseth NC (1995). A geographic gradient in small rodent density fluctuations: a statistical modeling approach. Proceedings of the Royal Society of London B, 262,127-133. |
| [4] | Chung MG (1996). Spatial genetic structure among Korean populations of Hosta minor and H. capitata (Liliaceae). Botanical Bulletin of Academia Sinica, 37,25-30. |
| [5] | Chung MG, Epperson BK (2000). Spatial genetic structure of allozyme polymorphisms in a population of Eurya japonica (Theaceae). Silvae Genetica, 49,1-4. |
| [6] | Chung MY, Nason J, Chung MG, Kim KJ, Park CW, Sun BY, Pak JH (2002). Landscape-level spatial genetic structure in Quercus acutissima (Fagaceae). American Journal of Botany, 89,1229-1236. |
| [7] | Clegg MT, Brown AHD (1983). The founding of plant populations. In: Schonewald-Cox CM, Chambers SM, MacBryde B, Thomas WL eds. Genetics and Conservation. Benjamin-Cummings, Menlo Park, CA,216-228. |
| [8] | Cottrell JC, Munro RC, Tabbener HE, Milner AD, Forrest GI, Lowe AJ (2003). Comparison of fine-scale genetic structure using nuclear microsatellites within two British oakwoods differing in population history. Forest Ecology and Management, 176,287-303. |
| [9] | Ellstrand NC, Elam DR (1993). Population genetic consequences of small population size: implications for plant conservation. Annual Review Ecology and Systematics, 34,217-242. |
| [10] |
Epperson BK, Allard RW (1989). Spatial structure of two-locus genotypes under isolation by distance. Genetics, 140,365-375.
URL PMID |
| [11] | Epperson BK (1990). Spatial patterns of genetic variation within plant populations. In: Brown AHD, Clegg MT, Kahler AL, Weir BS eds. Plant Population Genetics,Breeding and Genetic Resources. Sinauer Associates, MA,229-253. |
| [12] | Epperson BK (1992). Spatial structure of genetic variation within populations of forest trees. New Forests, 6,257-278. |
| [13] | Epperson BK (1993). Recent advances in correlation studies of spatial patterns of genetic variation. Evolutionary Biology, 27,95-155. |
| [14] | Escudero A, Iriondo JM, Torres ME (2003). Spatial analysis of genetic diversity as a tool for plant conservation. Biological Conservation, 113,351-365. |
| [15] | Geburek T (1993). Are gene randomly distributed over space in mature populations of sugar maple ( Acer saccharum Marsh.)? Annals of Botany, 71,217-222. |
| [16] | Huang HW (黄宏文) (1998). Review of current research of the world Castanea species and importance of germplasm conservation of China native Castanea species. Journal of Wuhan Botanical Research (武汉植物学研究), 16,171-176. (in Chinese) |
| [17] | Lang P (郎萍), Huang HW (黄宏文) (1999). Genetic diversity and geographic variation in natural populations of the endemic Castanea species in China. Acta Botanica Sinica (植物学报), 41,651-657. (in Chinese with English abstract) |
| [18] | Levin DA, Kerster HW (1974). Gene flow in seed plants. Evoutionary Biology, 7,139-220. |
| [19] | Li CC, Horvitz DG (1953). Some methods of estimating the inbreeding coefficient. American Journal of Human Genetics, 5,107-117. |
| [20] | Li ZZ (李作洲), Lang P (郎萍), Huang HW (黄宏文) (2002). Spatial structure of allozyme frequencies in Castanea mollissima BL. Journal of Wuhan Botanical Research (武汉植物学研究), 20,165-170.. (in Chinese with English abstract) |
| [21] | Liu EH, Godt MJW (1983). The differentiation of populations over short distance. In: Schonewald-Cox CM, Chambers MS, MacBryde B, Thomas W eds. Genetics and Conservation. The Benjamin/Cummings Publishing Company Inc, California,78-95. |
| [22] | Marinoni D, Akkak A, Bounous G, Edwards KJ, Botta R (2003). Development and characterization of microsatellite markers in Castanea sativa(Mill.). Molecular Breeding, 11,127-136. |
| [23] | Marquardt PE, Epperson BK (2004). Spatial and population genetic structure of microsatellites in white pine. Molecular Ecology, 13,3305-3315. |
| [24] | McCauley DE, Stevens JE, Peroni PA, Raveill JA (1996). The spatial distribution of chloroplast DNA and allozyme polymorphisms within a population of Silene alba (Caryophyllaceae). American Journal of Botany, 83,727-731. |
| [25] | Peakall R, Smouse PE (2001). GenAlEx V5: Genetic Analysis in Excel. Population Genetic Software for Teaching and Research. Australian National University, Canberra, Australia. |
| [26] | Pigliucci M, Villani F, Benedettelli S (1990). Geographic and climatic factors associated with the spatial structure of gene frequencies in Castanea sativa Mill.from Turkey. Journal of Genetics, 69,141-149. |
| [27] | Robert R, Sokal FMLS (1978). Spatial autocorrelation in biology. Biological Journal of the Linnean Society, 10,199-228. |
| [28] |
Rogers SO, Bendich AJ (1985). Extraction of DNA from milligram amount of fresh, herbarium and mummified plant tissues. Plant Molecular Biology, 5,69-76.
URL PMID |
| [29] | Rutter PA, Miller G, Payne JA (1990). Chestnuts. In: Moore JN, Ballington JR Jr eds. Genetic Resources of Temperate Fruit and Nut Crops. The International Society for Horticultural Science, Wageningen, The Netherlands,761-788. |
| [30] | Sanguinetti CJ, Dias NE, Simpson AJG (1994). Rapid silver staining and recovery of PCR products separated on polyacrylamide gels. Biotechniques, 17,915-919. |
| [31] | Schaal BA, Levin DA (1976). The demographic genetics of Liatris cylindracea Michx. The American Naturalist, 110,191-206. |
| [32] |
Slatkin M, Barton H (1989). A comparison of three indirect methods for estimating average levels of gene flow. Evolution, 43,1349-1368.
DOI URL PMID |
| [33] | Sokal RR, Oden NL (1978a). Spatial autocorrelation in bilology. 1. Methodology. Biological Journal of the Linnean Society, 10,199-228. |
| [34] |
Sokal RR, Oden NL (1978b). Spatial autocorrelation in bilology. 2. Some biological implications and four apolications of evolutionary and ecological interest. Biological Journal of the Linnean Society, 10,229-249.
DOI URL |
| [35] |
Sokal RR, Jacquez GM, Wooten M (1989). Spatial autocorrelation analysis of migration and selection. Genetics, 121,845-855.
URL PMID |
| [36] |
Streiff R, Labbe T, Bacilieri R, Steinkellner H, Glossl H, Kremer A (1998). Within-population genetic structure in Quercus robur L. & Quercus petraea (Matt.) Leibl. assessed with isozymes and microsatellites. Molecular Ecology, 7,317-328.
DOI URL |
| [37] |
Vekemans X, Hardy OJ (2004). New insights from fine-scale spatial genetic structure analyses in plant populations. Molecular Ecology, 13,921-935.
URL PMID |
| [38] |
Vornam B, Decarli N, Gailing O (2004). Spatial distribution of genetic variation in a natural beech stand ( Fagus sylvatica L.) based on microsatellite markers. Conservation Genetics, 5,561-570.
DOI URL |
| [39] | Waternberg D (1989). SAAP 4.3.—A Spatial Autocorrelation Analysis Program. Exeter Software, Setauket, NY, USA. |
| [40] |
Weir BS, Cockerham CC (1984). Estimating F-statistics for the analysis of population structure. Evolution, 38,1358-1370.
DOI URL PMID |
| [41] |
Williams CG, Hamrick JL (1996). Elite populations for conifer breeding and gene conservation. Canadian Journal of Forest Research, 26,453-461.
DOI URL |
| [42] |
Workman PL, Niswander JD (1970). Population studies on southwestern Indian tribes.II.Local genetic differentiation in the Papago. American Journal of Human Genetics, 22,24-49.
URL PMID |
| [1] | 黄承玲, 黎荣瀚, 覃红玲, 杨胜雄, 田晓玲, 夏国威, 陈正仁, 周玮. 基于SNP分子标记的极小种群植物荔波杜鹃保护遗传学[J]. 植物生态学报, 2025, 49(10): 1677-1684. |
| [2] | 陈天翌, 娄安如. 青藏高原东侧白桦种群的遗传多样性与遗传结构[J]. 植物生态学报, 2022, 46(5): 561-568. |
| [3] | 欧文慧, 刘亚恒, 李娜, 徐芷妍, 彭秋桐, 杨予静, 李中强. 柴达木盆地水生植物多样性格局及多假说验证[J]. 植物生态学报, 2021, 45(11): 1213-1220. |
| [4] | 张新新, 王茜, 胡颖, 周玮, 陈晓阳, 胡新生. 植物边缘种群遗传多样性研究进展[J]. 植物生态学报, 2019, 43(5): 383-395. |
| [5] | 张俪文, 韩广轩. 植物遗传多样性与生态系统功能关系的研究进展[J]. 植物生态学报, 2018, 42(10): 977-989. |
| [6] | 陈永刚, 汤孟平, 杨春菊, 马天午, 王礼. 天然毛竹林竞争空间关系分析[J]. 植物生态学报, 2015, 39(7): 726-735. |
| [7] | 王锦楠, 陈进福, 陈武生, 周新洋, 许东, 李际红, 亓晓. 柴达木地区野生黑果枸杞种群遗传多样性的AFLP分析[J]. 植物生态学报, 2015, 39(10): 1003-1011. |
| [8] | 刘军, 姜景民, 邹军, 徐金良, 沈汉, 刁松峰. 中国特有濒危树种毛红椿核心和边缘居群的遗传多样性[J]. 植物生态学报, 2013, 37(1): 52-60. |
| [9] | 许涵, 李意德, 骆土寿, 陈德祥, 林明献. 海南尖峰岭不同热带雨林类型与物种多样性变化关联的环境因子[J]. 植物生态学报, 2013, 37(1): 26-36. |
| [10] | 张炜, 罗建勋, 辜云杰, 胡庭兴. 西南地区麻疯树天然种群遗传多样性的等位酶变异[J]. 植物生态学报, 2011, 35(3): 330-336. |
| [11] | 魏源, 王世杰, 刘秀明, 黄天志. 不同喀斯特小生境中土壤丛枝菌根真菌的遗传多样性[J]. 植物生态学报, 2011, 35(10): 1083-1090. |
| [12] | 张云红, 侯艳, 娄安如. 华北地区小丛红景天种群的AFLP遗传多样性[J]. 植物生态学报, 2010, 34(9): 1084-1094. |
| [13] | 刘伟, 王曦, 干友民, 黄林凯, 谢文刚, 苗佳敏. 高山嵩草种群在放牧干扰下遗传多样性的变化[J]. 植物生态学报, 2009, 33(5): 966-973. |
| [14] | 张冬梅, 孙佩光, 沈熙环, 茹广欣. 油松种子园自由授粉与控制授粉种子父本分析[J]. 植物生态学报, 2009, 33(2): 302-310. |
| [15] | 陈良华, 胡庭兴, 张帆, 李国和. 用AFLP技术分析四川核桃资源的遗传多样性[J]. 植物生态学报, 2008, 32(6): 1362-1372. |
| 阅读次数 | ||||||
|
全文 |
|
|||||
|
摘要 |
|
|||||
Copyright © 2026 版权所有 《植物生态学报》编辑部
地址: 北京香山南辛村20号, 邮编: 100093
Tel.: 010-62836134, 62836138; Fax: 010-82599431; E-mail: apes@ibcas.ac.cn, cjpe@ibcas.ac.cn
备案号: 京ICP备16067583号-19
![]()