
植物生态学报 ›› 2010, Vol. 34 ›› Issue (4): 409-417.DOI: 10.3773/j.issn.1005-264x.2010.04.006
孙洪刚1, 张建国2,*( ), 段爱国2
收稿日期:2009-06-09
接受日期:2010-01-25
出版日期:2010-06-09
发布日期:2010-04-01
通讯作者:
张建国
作者简介:* E-mail: zhangjg@caf.ac.cn
SUN Hong-Gang1, ZHANG Jian-Guo2,*(), DUAN Ai-Guo2
Received:2009-06-09
Accepted:2010-01-25
Online:2010-06-09
Published:2010-04-01
Contact:
ZHANG Jian-Guo
摘要:
自疏边界线是指植物种群发生密度依赖死亡时种群最大收获量的上边界线。已有研究由于在拟合自疏边界线的过程中对数据点的选择和参数估计的方法存在诸多的差异, 进而导致产生对自疏法则的争议。该研究采用26年生杉木(Cunninghamia lanceolata)人工林的定位观测数据, 对视觉法、死亡率法、等距区间法和相对密度法等4种数据点选择方法以及最小二乘法、降维分析法、分位数回归法和随机边界方程等4种参数拟合方法进行对比分析, 以探寻客观选择自疏拟合数据和正确拟合方法的途径。比较4种不同的数据选择方法得出: 视觉法具有较强的主观性; 对于没有发生非密度依赖死亡的林分, 死亡率法可以准确地确定林分自疏的起始点; 等距区间法可以减少非密度依赖死亡的影响, 得到的数据点能充分反映林分的自疏过程; 相对密度法可以保证临界密度阈值以上的数据点拟合林分自疏边界线的有效性, 并能排除非密度依赖死亡的影响。比较分析4种不同的拟合方法发现: 最小二乘法和降维分析法拟合的林分自疏边界线均从实测数据“中心”穿过, 与林分自疏边界线为林分收获量上边界线的涵义不相符合, 无法真实反映林分的自疏进程; 分位数回归和随机边界方程的拟合结果均与实测数据一致, 能够较为准确地反映林分自疏的真实过程, 但二者的统计推断要求都比较严格。分位数值的正确选取和残差足够小且趋于0, 是分位数回归法和随机边界方程能否正确反映林分自疏动态的前提。
孙洪刚, 张建国, 段爱国. 数据点选择与参数估计方法对杉木人工林自疏边界线的影响. 植物生态学报, 2010, 34(4): 409-417. DOI: 10.3773/j.issn.1005-264x.2010.04.006
SUN Hong-Gang, ZHANG Jian-Guo, DUAN Ai-Guo. A comparison of selecting data points and fitting coefficients methods for estimating self-thinning boundary line. Chinese Journal of Plant Ecology, 2010, 34(4): 409-417. DOI: 10.3773/j.issn.1005-264x.2010.04.006
| 样地 Plot | 初植密度 Planting density (trees·hm-2) | 2006年林分密度 Stand density in 2006 (trees·hm-2) | 林分平均胸径 Mean diameter of breast height (cm) | 标准差 SD | 胸径最小值 Minimum diameter of breast height (cm) | 胸径最大值 Maximum diameter of breast height (cm) |
|---|---|---|---|---|---|---|
| B2 | 3 333 | 2 517 | 10.65 | 2.42 | 6.49 | 13.80 |
| B3 | 3 333 | 2 483 | 12.29 | 2.71 | 7.58 | 16.23 |
| C2 | 5 000 | 3 467 | 9.57 | 2.44 | 5.51 | 13.16 |
| C3 | 5 000 | 2 417 | 10.21 | 2.74 | 6.04 | 14.04 |
| D1 | 6 667 | 3 317 | 8.76 | 2.02 | 5.53 | 11.90 |
| D2 | 6 667 | 4 267 | 8.85 | 2.67 | 4.95 | 13.14 |
| D3 | 6 667 | 3 800 | 9.13 | 2.62 | 5.33 | 13.26 |
| E1 | 10 000 | 5 117 | 8.39 | 2.01 | 5.55 | 11.70 |
| E2 | 10 000 | 3 183 | 8.42 | 2.50 | 4.80 | 13.08 |
| E3 | 10 000 | 5 217 | 8.75 | 2.71 | 5.10 | 13.11 |
表1 样地基本情况统计
Table 1 Descriptive statistics of plots
| 样地 Plot | 初植密度 Planting density (trees·hm-2) | 2006年林分密度 Stand density in 2006 (trees·hm-2) | 林分平均胸径 Mean diameter of breast height (cm) | 标准差 SD | 胸径最小值 Minimum diameter of breast height (cm) | 胸径最大值 Maximum diameter of breast height (cm) |
|---|---|---|---|---|---|---|
| B2 | 3 333 | 2 517 | 10.65 | 2.42 | 6.49 | 13.80 |
| B3 | 3 333 | 2 483 | 12.29 | 2.71 | 7.58 | 16.23 |
| C2 | 5 000 | 3 467 | 9.57 | 2.44 | 5.51 | 13.16 |
| C3 | 5 000 | 2 417 | 10.21 | 2.74 | 6.04 | 14.04 |
| D1 | 6 667 | 3 317 | 8.76 | 2.02 | 5.53 | 11.90 |
| D2 | 6 667 | 4 267 | 8.85 | 2.67 | 4.95 | 13.14 |
| D3 | 6 667 | 3 800 | 9.13 | 2.62 | 5.33 | 13.26 |
| E1 | 10 000 | 5 117 | 8.39 | 2.01 | 5.55 | 11.70 |
| E2 | 10 000 | 3 183 | 8.42 | 2.50 | 4.80 | 13.08 |
| E3 | 10 000 | 5 217 | 8.75 | 2.71 | 5.10 | 13.11 |
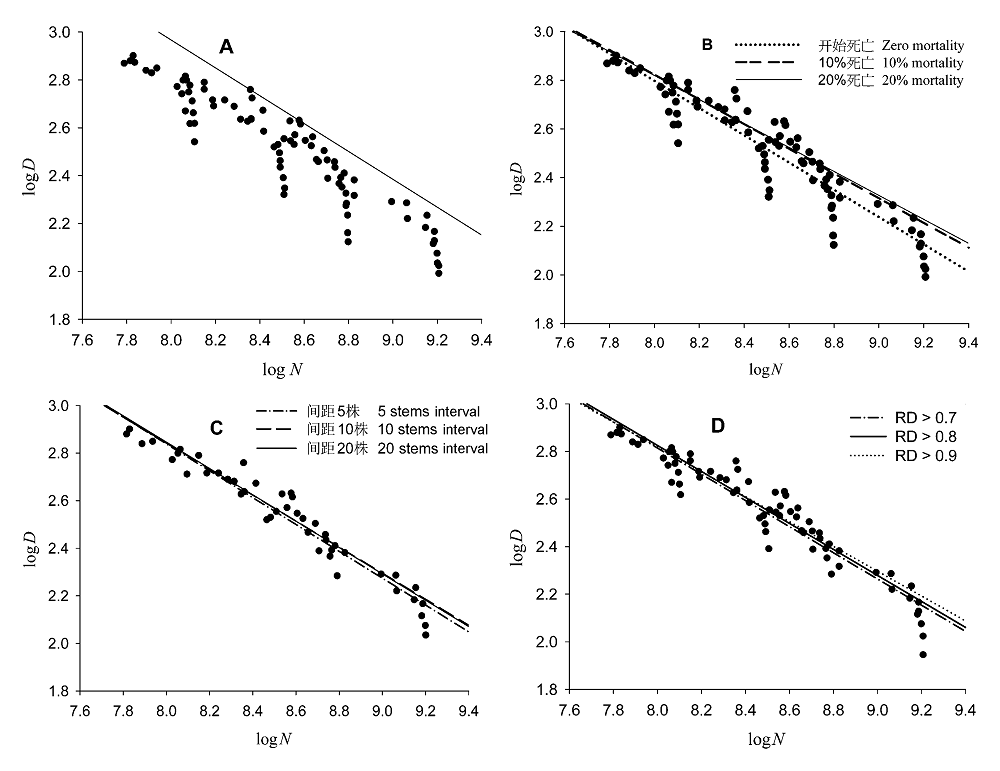
图1 4种拟合方法下林分密度与平均胸径的关系。 A, 视觉法。B, 死亡率法。C, 等距区间法。D, 相对密度(RD)法。
Fig. 1 Relationship between stand density (N) and mean diameter of breast height (D) under four regression methods. A, Visualized inspection. B, Mortality criterion. C, Equal intervals. D, Relative density (RD).
| 数据点选择方法及数量 Selecting data points and numbers (n) | 斜率(标准误差) Slope (SE) | 截距(标准误差) Intercept (SE) | R2 |
|---|---|---|---|
| 死亡率法 Mortality criterion | |||
| 开始死亡 Zero mortality (83) | -0.56 (0.046) | 7.28 (0.612) | 0.817 |
| 10%死亡 10% mortality (51) | -0.51 (0.037) | 6.79 (0.435) | 0.931 |
| 20%死亡 20% mortality (37) | -0.49 (0.029) | 6.19 (0.367) | 0.934 |
| 等距区间法 Equal intervals | |||
| 5株 5 stems (43) | -0.62 (0.071) | 7.91 (0.610) | 0.917 |
| 10株 10 stems (31) | -0.55 (0.069) | 7.26 (0.583) | 0.922 |
| 20株 20 stems (19) | -0.54 (0.089) | 7.23 (0.762) | 0.939 |
| 相对密度法 Relative density (RD) | |||
| RD > 0.7 (71) | -0.58 (0.069) | 7.14 (0.583) | 0.883 |
| RD > 0.8 (62) | -0.54 (0.056) | 7.09 (0.472) | 0.929 |
| RD > 0.9 (57) | -0.53 (0.057) | 6.70 (0.478) | 0.900 |
表2 数据点选择方法及拟合系数的比较
Table 2 Comparison of the selecting data points and fitting coefficients
| 数据点选择方法及数量 Selecting data points and numbers (n) | 斜率(标准误差) Slope (SE) | 截距(标准误差) Intercept (SE) | R2 |
|---|---|---|---|
| 死亡率法 Mortality criterion | |||
| 开始死亡 Zero mortality (83) | -0.56 (0.046) | 7.28 (0.612) | 0.817 |
| 10%死亡 10% mortality (51) | -0.51 (0.037) | 6.79 (0.435) | 0.931 |
| 20%死亡 20% mortality (37) | -0.49 (0.029) | 6.19 (0.367) | 0.934 |
| 等距区间法 Equal intervals | |||
| 5株 5 stems (43) | -0.62 (0.071) | 7.91 (0.610) | 0.917 |
| 10株 10 stems (31) | -0.55 (0.069) | 7.26 (0.583) | 0.922 |
| 20株 20 stems (19) | -0.54 (0.089) | 7.23 (0.762) | 0.939 |
| 相对密度法 Relative density (RD) | |||
| RD > 0.7 (71) | -0.58 (0.069) | 7.14 (0.583) | 0.883 |
| RD > 0.8 (62) | -0.54 (0.056) | 7.09 (0.472) | 0.929 |
| RD > 0.9 (57) | -0.53 (0.057) | 6.70 (0.478) | 0.900 |
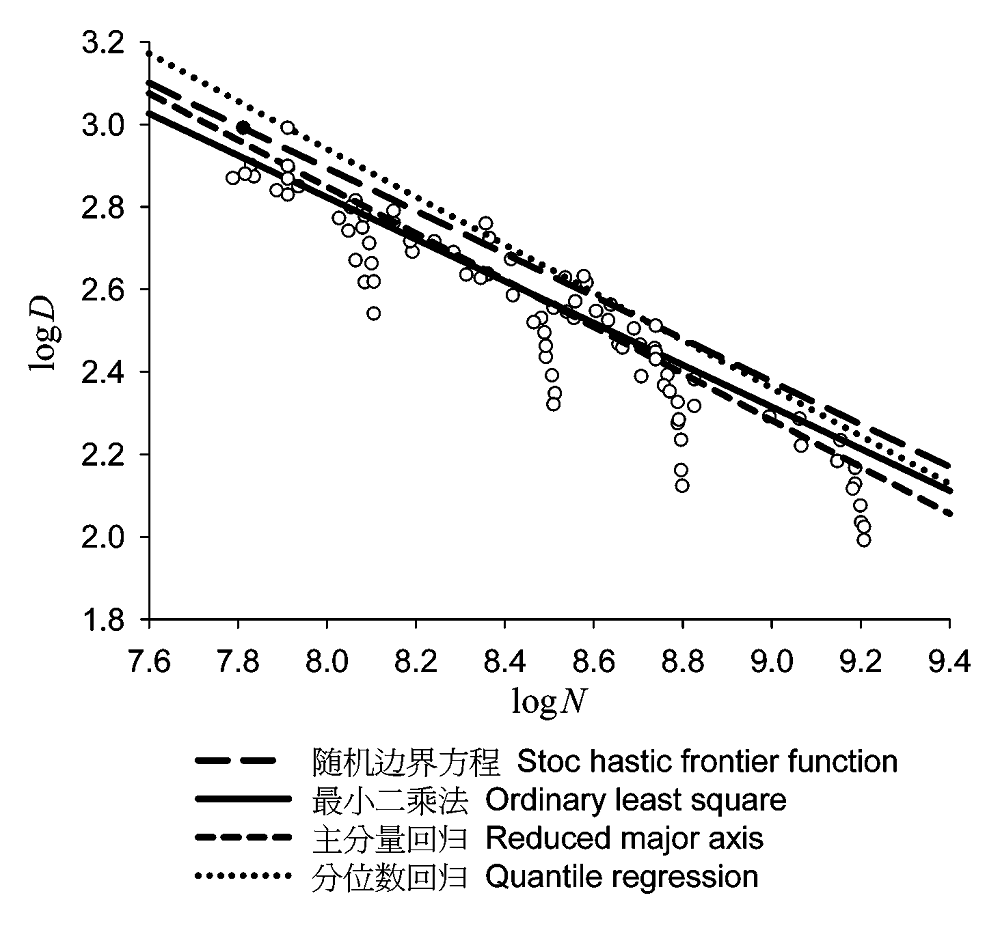
图2 4种自疏线拟合方法的比较。
Fig. 2 Comparison of four fitting self-thinning boundary line methods.
| 回归方法 Regression technique | 斜率 Slope | 截距 Intercept |
|---|---|---|
| 随机边界方程 Stochastic frontier function | -0.52 | 7.03 |
| 最小二乘法 Ordinary least squares regression | -0.54 | 7.63 |
| 降维分析法 Reduced major axis | -0.57 | 7.39 |
| 分位数回归法 Quantile regression | -0.52 | 7.05 |
表3 4种拟合方法的回归系数
Table 3 Regression coefficients of the four models
| 回归方法 Regression technique | 斜率 Slope | 截距 Intercept |
|---|---|---|
| 随机边界方程 Stochastic frontier function | -0.52 | 7.03 |
| 最小二乘法 Ordinary least squares regression | -0.54 | 7.63 |
| 降维分析法 Reduced major axis | -0.57 | 7.39 |
| 分位数回归法 Quantile regression | -0.52 | 7.05 |
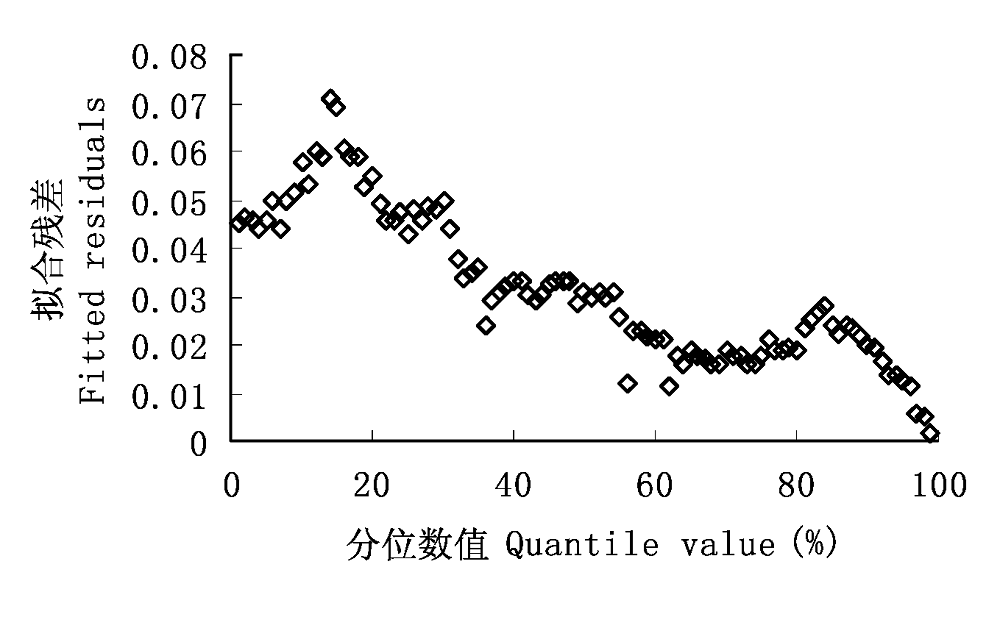
图3 分位数值的选取与拟合残差的关系。
Fig. 3 Relationship between quantile value and fitted residuals.
| [1] | Bi H (2001). The self-thinning surface. Forest Science, 47, 361-370. |
| [2] | Bi H, Turvey ND (1997). A method of selecting data points for fitting the maximum biomass-density line for stand undergoing self-thinning. Australian Journal of Ecology, 22, 356-359. |
| [3] | Bi H, Wan G, Turvey ND (2000). Estimating the self-thinning boundary line as a density-dependent stochastic biomass frontier. Ecology, 81, 1477-1483. |
| [4] | Cade BS, Terrell JW, Schroeder RL (1999). Estimating effects of limiting factors with regression quantiles. Ecology, 80, 311-323. |
| [5] | Drew TJ, Flewelling JW (1979). Stand density management: an alternative approach and its application to Douglas-fir plantations. Forest Science, 25, 518-532. |
| [6] | Econometric Software (1998). LIMDEP 7. 0 User’s Manual (Computer Manual). Econometric Software. Plainview, New York, USA. |
| [7] | Enquist BJ, Brown JH, West GB (1998) . Allometric scaling of plant energetics and population density. Nature, 395, 163-165. |
| [8] | Fang JY (方精云) (1992). Self-thinning rule in plant population. Rural Eco-Environment (农村生态环境), 2, 7-12. (in Chinese with English abstract) |
| [9] | Fang JY (方精云), Jian C (菅诚), Yamakura T (1991). Relationships between population growth and population density in monocultures of Larix leptolepis. Acta Botanica Sinica (植物学报), 33, 949-957. (in Chinese with English abstract) |
| [10] | Gorham E (1979). Shoot height, weight and standing crop in relation to density of monospecific plant stands. Nature, 279, 148-150. |
| [11] | Jack SB, Long JN (1996). Linkages between silviculture and ecology: an analysis of density management diagrams. Forest Ecology and Management, 86, 205-220. |
| [12] | Kikuzawa K (1999). Theoretical relationships between mean plant size, size distribution and self thinning under one-sided competition. Annals of Botany, 83, 11-18. |
| [13] | Koenker R, Bassett G (1978). Regression quantiles. Econometrica, 46, 33-50. |
| [14] | LaBarbera M (1989). Analyzing body size as factor in ecology and evolution. Annual Review of Ecology and Systematics, 20, 97-117. |
| [15] | Li B, Wu H, Zou G (2000). Self-thinning rule: a causal interpretation from ecological field theory. Ecological Modelling, 132, 167-173. |
| [16] | Lonsdale W (1990). The self-thinning rule: dead or alive? Ecology, 71, 1373-1388. |
| [17] |
Long JN, Smith FW (1984). Relation between size and density in developing stands: a description and possible mechanisms. Forest Ecology and Management, 7, 191-206.
DOI URL |
| [18] |
Mohler C, Marks P, Sprugel DG (1978). Stand structure and allometry of trees during self-thinning of pure stands. Journal of Ecology, 66, 599-614.
DOI URL |
| [19] | Newton PF (2006). Asymptotic size-density relationships within self-thinning black spruce and jack pine stand- types: parameter estimation and model reformulations. Forest Ecology and Management, 226, 49-59. |
| [20] | Osawa A (1995). Inverse relationship of crown fractal dimension to self-thinning exponent of tree population: a hypothesis. Canadian Journal of Forestry Research, 25, 1608-1617. |
| [21] |
Osawa A, Allen RB (1993). Allometric theory explains self-thinning relationships of mountain beech and red pine. Ecology, 74, 1020-1032.
DOI URL |
| [22] |
Osawa A, Sugita S (1989). The self-thinning rule: another interpretation of Weller’s results. Ecology, 70, 279-283.
DOI URL |
| [23] | Río M, Montero G, Bravo F (2001). Analysis of diameter- density relationships and self-thinning in non-thinned even-aged Scots pine stands. Forest Ecology and Management, 142, 79-87. |
| [24] | Roderick ML, Barnes B (2004). Self-thinning of plant populations from a dynamic viewpoint. Functional Ecology, 18, 197-203. |
| [25] | SAS Institute (1999). SAS/STAT User's Guide, Version 8 (Computer Manual). SAS Institute Inc., Cary, New York, USA. |
| [26] | Scharf FS, Juanes F, Sutherland M (1998). Inferring ecological relationships from the edges of scatter diagrams: comparison of regression techniques. Ecology, 79, 448-460. |
| [27] | Solomon DS, Zhang L (2002). Maximum size-density relationships for mixed softwoods in the northeastern USA. Forest Ecology and Management, 155, 163-170. |
| [28] | Weller DE (1987). A reevaluation of the -3/2 power rule of plant self-thinning. Ecological Monographs, 57, 23-43. |
| [29] | Weller DE (1989). The interspecific size-density relationship among crowded plant stands and its implications for the -3/2 power rule of self-thinning. American Naturalist, 133, 20-41. |
| [30] | Westoby M (1984). The self-thinning rule. Advances in Ecological Research, 14, 167-225. |
| [31] | White J (1981). The allometric interpretation of the self- thinning rule. Journal of Theoretical Biology, 89, 475-500. |
| [32] | Wilson DS, Seymour RS, Maguire DA (1999). Density management diagram for Northeastern red spruce and balsam fir forests. Northern Journal of Applied Forestry, 16, 48-56. |
| [33] | Yang Y, Titus SJ (2002). Maximum size-density relationship for constraining individual tree mortality functions. Forest Ecology and Management, 168, 259-273. |
| [34] | Yoda K, Kira T, Ogawa H (1963). Self-thinning in overcrowded pure stand under cultivated and natural conditions. Journal of Biology of Osaka City University, 14, 107-129. |
| [35] | Zeide B (1987). Analysis of the 3/2 power law of self-thinning. Forest Science, 33, 517-537. |
| [1] | 吴帆, 吴晨, 张宇辉, 余恒, 魏智华, 郑蔚, 刘小飞, 陈仕东, 杨智杰, 熊德成. 增温对成熟杉木人工林不同季节细根生长、形态及生理代谢特征的影响[J]. 植物生态学报, 2023, 47(6): 856-866. |
| [2] | 谢欢, 张秋芳, 陈廷廷, 曾泉鑫, 周嘉聪, 吴玥, 林惠瑛, 刘苑苑, 尹云锋, 陈岳民. 氮添加促进丛枝菌根真菌和根系协作维持土壤磷有效性[J]. 植物生态学报, 2022, 46(7): 811-822. |
| [3] | 谢欢, 张秋芳, 曾泉鑫, 周嘉聪, 马亚培, 吴玥, 刘苑苑, 林惠瑛, 尹云锋, 陈岳民. 氮添加对杉木苗期磷转化和分解类真菌的影响[J]. 植物生态学报, 2022, 46(2): 220-231. |
| [4] | 丁凯, 张毓婷, 张俊红, 柴雄, 周世水, 童再康. 不同密度杉木林对林下植被和土壤微生物群落结构的影响[J]. 植物生态学报, 2021, 45(1): 62-73. |
| [5] | 吕中诚, 康文星, 黄志宏, 赵仲辉, 邓湘雯. 不同林龄杉木组织迁移养分的再利用[J]. 植物生态学报, 2019, 43(5): 458-470. |
| [6] | 邹显花, 胡亚楠, 韦丹, 陈思同, 吴鹏飞, 马祥庆. 磷高效利用杉木对低磷胁迫的适应性与内源激素的相关性[J]. 植物生态学报, 2019, 43(2): 139-151. |
| [7] | 沈芳芳, 李燕燕, 刘文飞, 段洪浪, 樊后保, 胡良, 孟庆银. 长期氮沉降对杉木人工林叶、枝氮磷养分再吸收的影响[J]. 植物生态学报, 2018, 42(9): 926-937. |
| [8] | 陈日升, 康文星, 周玉泉, 田大伦, 项文化. 杉木人工林养分循环随林龄变化的特征[J]. 植物生态学报, 2018, 42(2): 173-184. |
| [9] | 彭曦, 闫文德, 王凤琪, 王光军, 玉昉永, 赵梅芳. 基于叶干质量比的杉木比叶面积估算模型的构建[J]. 植物生态学报, 2018, 42(2): 209-219. |
| [10] | 陈思同, 邹显花, 蔡一冰, 韦丹, 李涛, 吴鹏飞, 马祥庆. 基于 32P示踪的不同供磷环境杉木幼苗磷的分配规律分析[J]. 植物生态学报, 2018, 42(11): 1103-1112. |
| [11] | 张雷, 王琳琳, 刘世荣, 孙鹏森, 余振, 黄书涛, 张旭东. 生境概率预测值转换为二元值过程中4个阈值选择方法的比较评估——以珙桐和杉木生境预估为例[J]. 植物生态学报, 2017, 41(4): 387-395. |
| [12] | 史顺增, 熊德成, 邓飞, 冯建新, 许辰森, 钟波元, 陈云玉, 陈光水, 杨玉盛. 土壤增温、氮添加及其交互作用对杉木幼苗细根生产的影响[J]. 植物生态学报, 2017, 41(2): 186-195. |
| [13] | 李晓杰, 刘小飞, 熊德成, 林伟盛, 林廷武, 施友文, 谢锦升, 杨玉盛. 中亚热带杉木人工林和米槠次生林凋落物添加与去除对土壤呼吸的影响[J]. 植物生态学报, 2016, 40(5): 447-457. |
| [14] | 陈智裕, 李琦, 邹显花, 马祥庆, 吴鹏飞. 邻株竞争对低磷环境杉木幼苗光合特性及生物量分配的影响[J]. 植物生态学报, 2016, 40(2): 177-. |
| [15] | 张秋芳, 吕春平, 贝昭贤, 谢锦升, 吕茂奎, 林伟盛, 陈岳民, 杨玉盛. 野外模拟增温对亚热带杉木叶片膜脂过氧化及保护酶活性的影响[J]. 植物生态学报, 2016, 40(12): 1230-1237. |
| 阅读次数 | ||||||
|
全文 |
|
|||||
|
摘要 |
|
|||||
Copyright © 2026 版权所有 《植物生态学报》编辑部
地址: 北京香山南辛村20号, 邮编: 100093
Tel.: 010-62836134, 62836138; Fax: 010-82599431; E-mail: apes@ibcas.ac.cn, cjpe@ibcas.ac.cn
备案号: 京ICP备16067583号-19
![]()