
植物生态学报 ›› 2015, Vol. 39 ›› Issue (9): 890-900.DOI: 10.17521/cjpe.2015.0085 cstr: 32100.14.cjpe.2015.0085
徐世琴1,2, 吉喜斌1,*( ), 金博文1
收稿日期:2015-01-06
接受日期:2015-05-28
出版日期:2015-09-01
发布日期:2015-09-23
作者简介:* 共同第一作者 Co-first author
基金资助:
XU Shi-Qin1,2, JI Xi-Bin1,*(), JIN Bo-Wen1
Received:2015-01-06
Accepted:2015-05-28
Online:2015-09-01
Published:2015-09-23
About author:# Co-first authors
摘要:
蒸腾是植物重要的生理活动之一, 受到多个环境要素的综合影响。该文利用热平衡包裹式茎干液流仪Flow32监测系统, 对河西走廊中段绿洲—荒漠过渡带主要固沙植物梭梭(Haloxylon ammodendron)生长季的蒸腾过程进行连续监测, 并分析了其对环境要素的响应。结果表明: (1)梭梭茎干液流速率随枝直径的增加而增加, 液流密度随枝直径的增加而降低, 梭梭液流密度日变化呈多峰特征, 整个生长季液流密度变化比较稳定。(2)主成分分析表明第1、2、3主成分能够分别解释环境信息49%、15%、12%的变化, 第一主成分中水汽压亏缺、光合有效辐射及气温反映了大气的蒸腾需求。(3) S型模型对液流密度日变化模拟精度达到0.86, 考虑时滞效应后模拟精度提高至0.9, 降水天气条件下模拟精度降低至0.65。(4)液流密度对主要环境要素存在非对称响应, 同光合有效辐射呈逆时针环状, 同水汽压亏缺、蒸腾需求指数呈顺时针环状。
徐世琴, 吉喜斌, 金博文. 典型固沙植物梭梭生长季蒸腾变化及其对环境因子的响应. 植物生态学报, 2015, 39(9): 890-900. DOI: 10.17521/cjpe.2015.0085
XU Shi-Qin,JI Xi-Bin,JIN Bo-Wen. Dynamics and responses of sap flow of typical sand binding plants Haloxylon ammodendron to environmental variables. Chinese Journal of Plant Ecology, 2015, 39(9): 890-900. DOI: 10.17521/cjpe.2015.0085
| 编号 Numbers | 探头型号 Type of probe | 枝直径 Stem diameter (cm) |
|---|---|---|
| 1 | SGA5 | 0.27 |
| 2 | SGA9 | 0.47 |
| 3 | SGA13 | 0.75 |
| 4 | SGA13 | 0.66 |
| 5 | SGA19 | 1.02 |
| 6 | SGA25 | 1.32 |
| 7 | SGB25 | 1.24 |
表1 被测样枝参数
Tab1 e 1 Basic parameters of measured stems
| 编号 Numbers | 探头型号 Type of probe | 枝直径 Stem diameter (cm) |
|---|---|---|
| 1 | SGA5 | 0.27 |
| 2 | SGA9 | 0.47 |
| 3 | SGA13 | 0.75 |
| 4 | SGA13 | 0.66 |
| 5 | SGA19 | 1.02 |
| 6 | SGA25 | 1.32 |
| 7 | SGB25 | 1.24 |
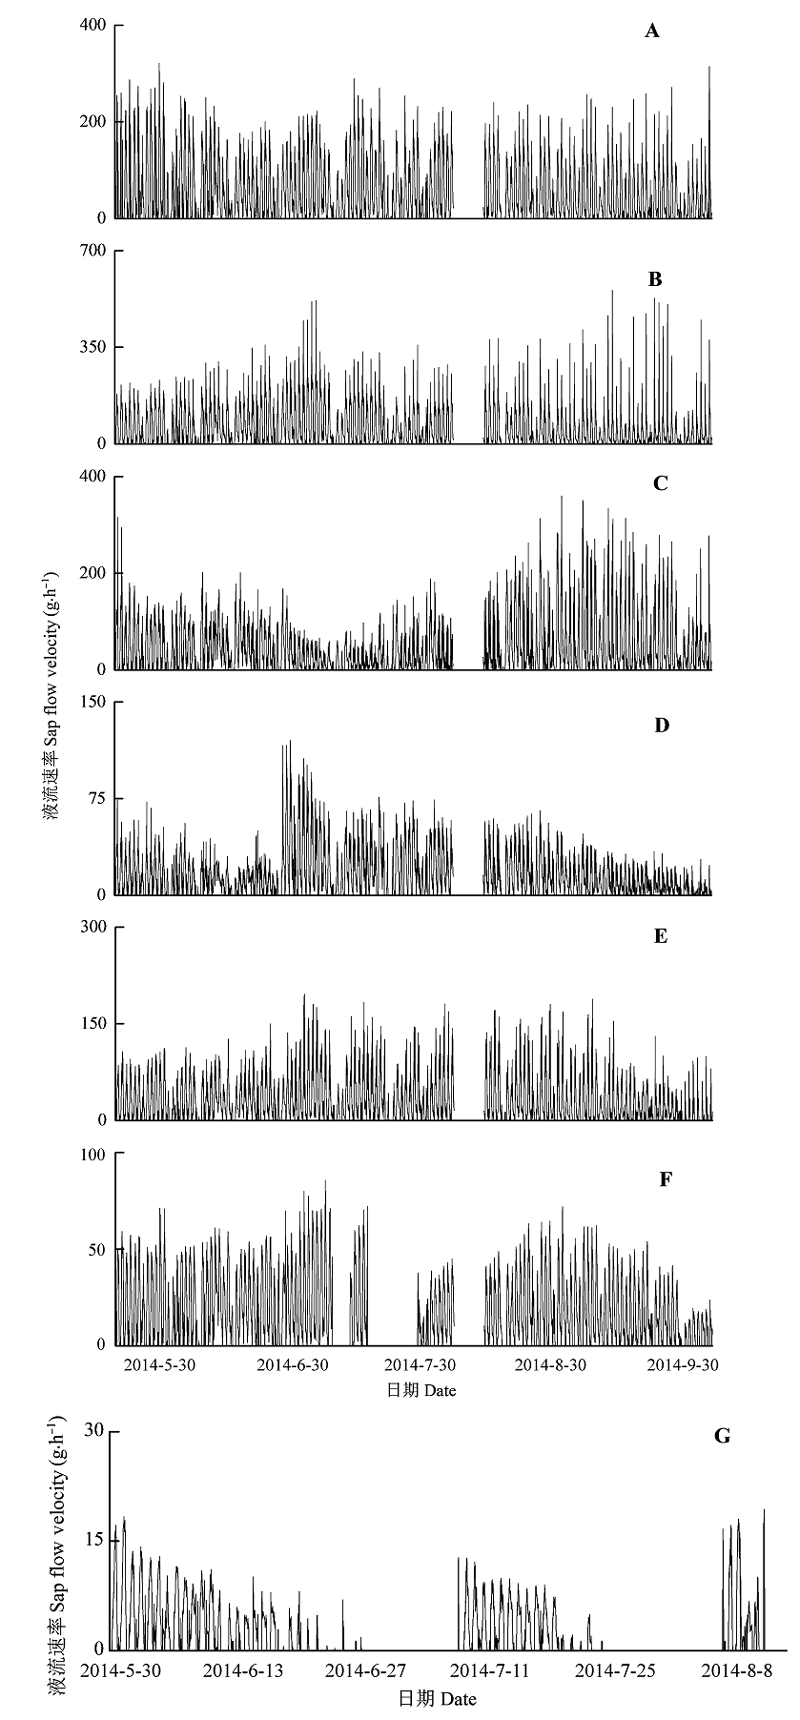
图1 不同基茎梭梭液流速率变化。A-G测量枝条的直径分别为1.32、1.24、1.02、0.75、0.66、0.47、0.27 cm。
Fig. 1 Variation of sap flow velocity of Haloxylon ammodendron with different diameters. A-G, diameters of 1.32, 1.24, 1.02, 0.75, 0.66, 0.47, 0.27 cm.
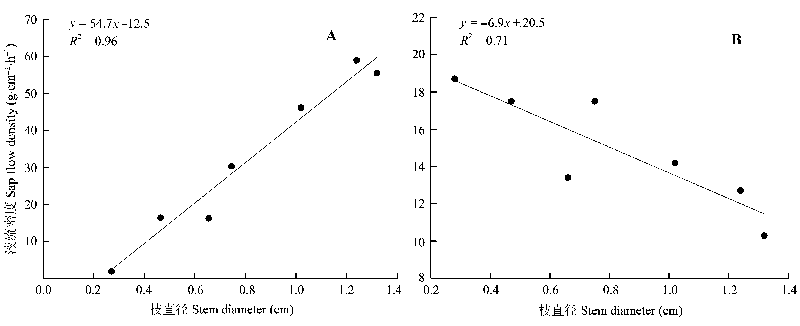
图2 枝直径同平均液流速率(A)、密度(B)的关系。
Fig. 2 The relationship between stem diameter and average sap flow velocity (A) and density (B).
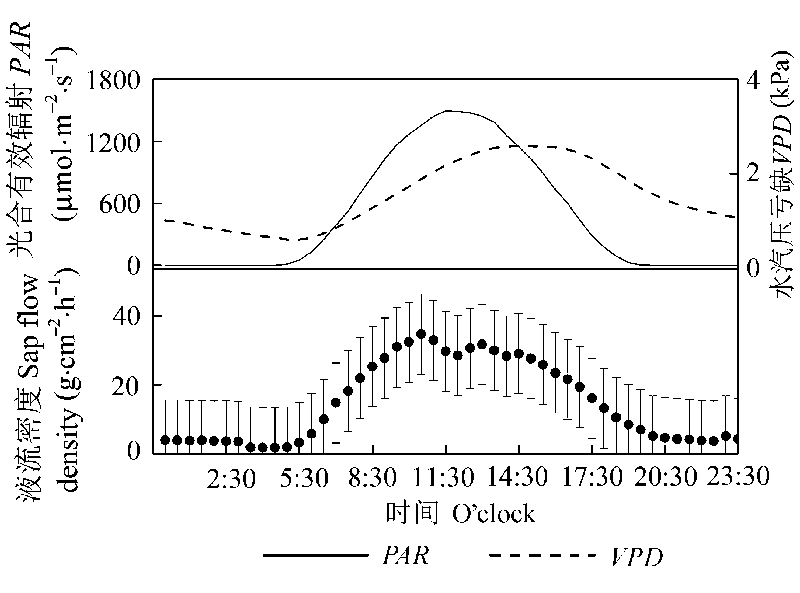
图3 观测期液流密度(平均值±标准偏差)及主要环境要素日变化。
Fig. 3 The diurnal change of sap flow density (mean ± SD) and principle environmental variables during study period. PAR, photosynthetic active radiation; VPD, vapour pressure deficit.
| 环境变量 Environmental variables | RH | VPD | Ta | Ts | Hs | V | P |
|---|---|---|---|---|---|---|---|
| PAR | 0.45** | 0.57** | 0.54** | 0.21** | 0.08** | 0.36** | -0.08** |
| RH | -0.84** | -0.65** | -0.50** | 0.05** | -0.34** | 0.22** | |
| VPD | 0.89** | 0.72** | 0.19** | 0.42** | -0.14** | ||
| Ta | 0.85** | 0.36** | 0.42** | -0.08** | |||
| Ts | 0.36** | 0.30** | -0.02 | ||||
| Hs | 0.04** | -0.01 | |||||
| V | -0.02 |
表2 基于30 min时间尺度的环境变量相关分析
Table 2 Correlations among the 30-min averages of weather variables measured during the study period
| 环境变量 Environmental variables | RH | VPD | Ta | Ts | Hs | V | P |
|---|---|---|---|---|---|---|---|
| PAR | 0.45** | 0.57** | 0.54** | 0.21** | 0.08** | 0.36** | -0.08** |
| RH | -0.84** | -0.65** | -0.50** | 0.05** | -0.34** | 0.22** | |
| VPD | 0.89** | 0.72** | 0.19** | 0.42** | -0.14** | ||
| Ta | 0.85** | 0.36** | 0.42** | -0.08** | |||
| Ts | 0.36** | 0.30** | -0.02 | ||||
| Hs | 0.04** | -0.01 | |||||
| V | -0.02 |
| 主成分 Principle component | 特征值 Eigenvalue | 解释方差 Total variance explained (%) | 累积解释方差 Cumulative variance explained (%) |
|---|---|---|---|
| 1 | 3.9 | 0.49 | 0.49 |
| 2 | 1.2 | 0.15 | 0.64 |
| 3 | 1.0 | 0.12 | 0.76 |
表3 基于主成分分析的前3个主成分特征值及其解释方差
Table 3 Eigenvalues and the variance explained by the first three axes of principle component analysis on the weather data
| 主成分 Principle component | 特征值 Eigenvalue | 解释方差 Total variance explained (%) | 累积解释方差 Cumulative variance explained (%) |
|---|---|---|---|
| 1 | 3.9 | 0.49 | 0.49 |
| 2 | 1.2 | 0.15 | 0.64 |
| 3 | 1.0 | 0.12 | 0.76 |
| 环境变量 Environmental variables | 主成分1 Factor 1 | 主成分2 Factor 2 | 主成分3 Factor 3 |
|---|---|---|---|
| PAR | 0.72 | -0.02 | -0.01 |
| VPD | 0.87 | 0.37 | -0.16 |
| Ts | 0.54 | 0.70 | -0.07 |
| Hs | -0.11 | 0.88 | 0.02 |
| V | 0.66 | -0.03 | 0.20 |
| P | -0.05 | 0.01 | 0.96 |
| Ta | 0.77 | 0.58 | -0.06 |
| RH | -0.82 | -0.08 | 0.29 |
表4 环境要素在前三个主成分轴上的载荷
Table 4 Factor loadings of the environmental variables on the first three axes of principle component analysis
| 环境变量 Environmental variables | 主成分1 Factor 1 | 主成分2 Factor 2 | 主成分3 Factor 3 |
|---|---|---|---|
| PAR | 0.72 | -0.02 | -0.01 |
| VPD | 0.87 | 0.37 | -0.16 |
| Ts | 0.54 | 0.70 | -0.07 |
| Hs | -0.11 | 0.88 | 0.02 |
| V | 0.66 | -0.03 | 0.20 |
| P | -0.05 | 0.01 | 0.96 |
| Ta | 0.77 | 0.58 | -0.06 |
| RH | -0.82 | -0.08 | 0.29 |
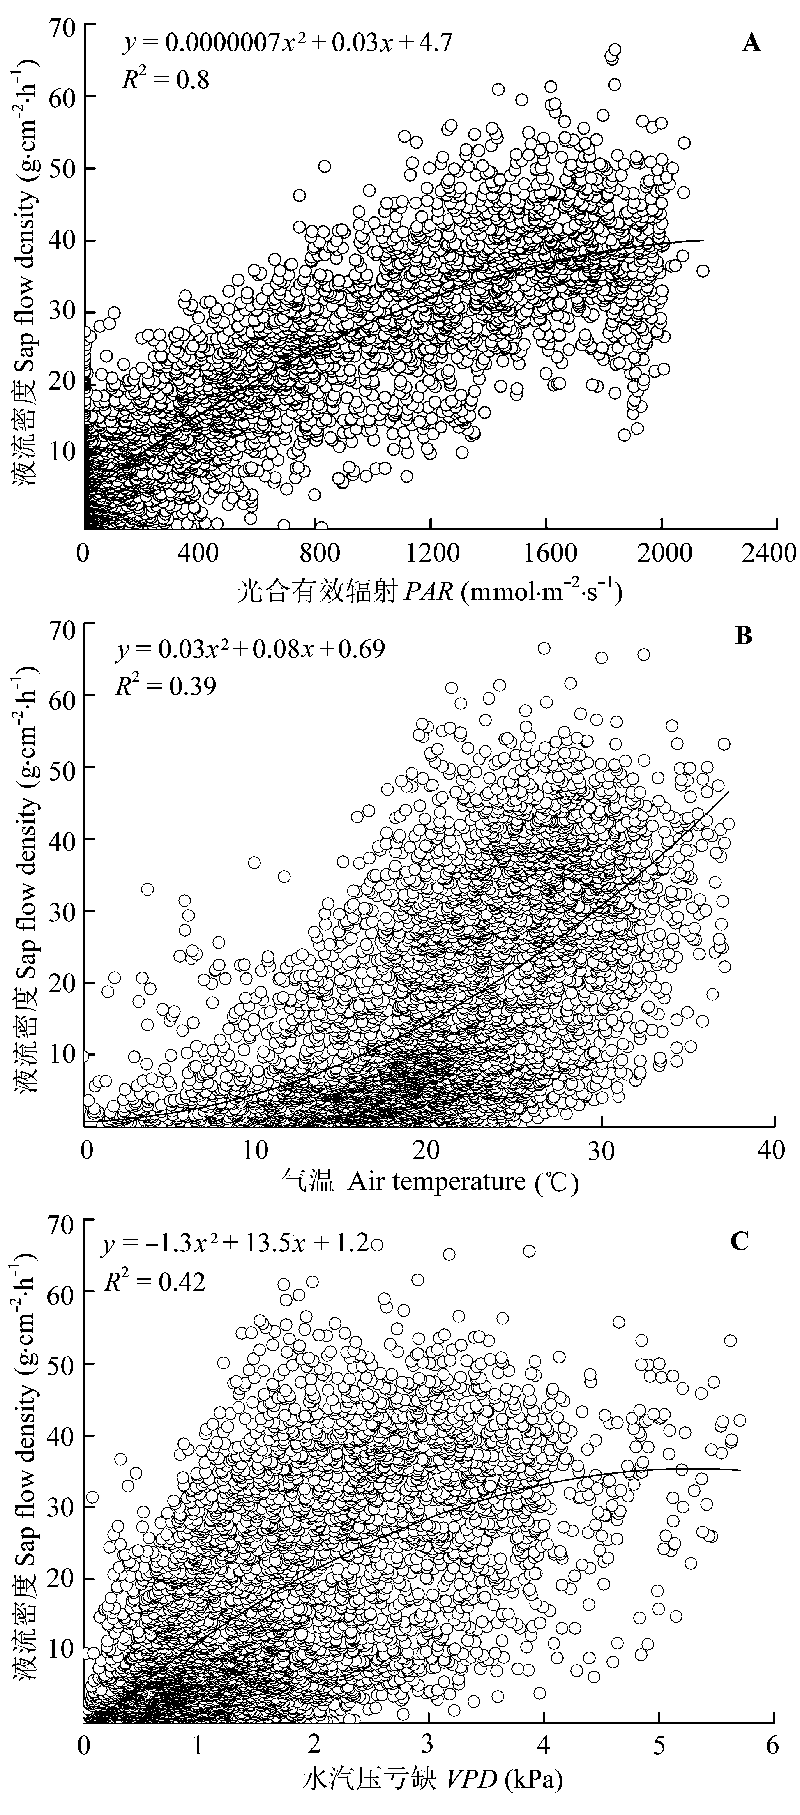
图4 液流密度对光合有效辐射(PAR)(A)、气温(B)和水汽压亏缺(VPD)(C)的响应。
Fig. 4 Response of sap flow density photosynthetically active radiation (PAR) (A), air temperature (B), and vapour pressure deficit (VPD) (C).
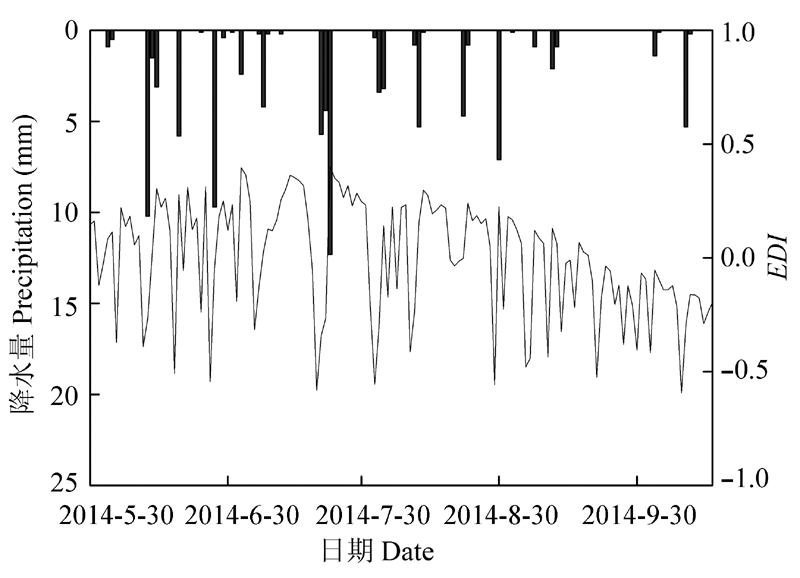
图5 蒸腾需求指数(EDI)动态变化。
Fig. 5 Daily variation of evaporative demand index (EDI) during the study period.
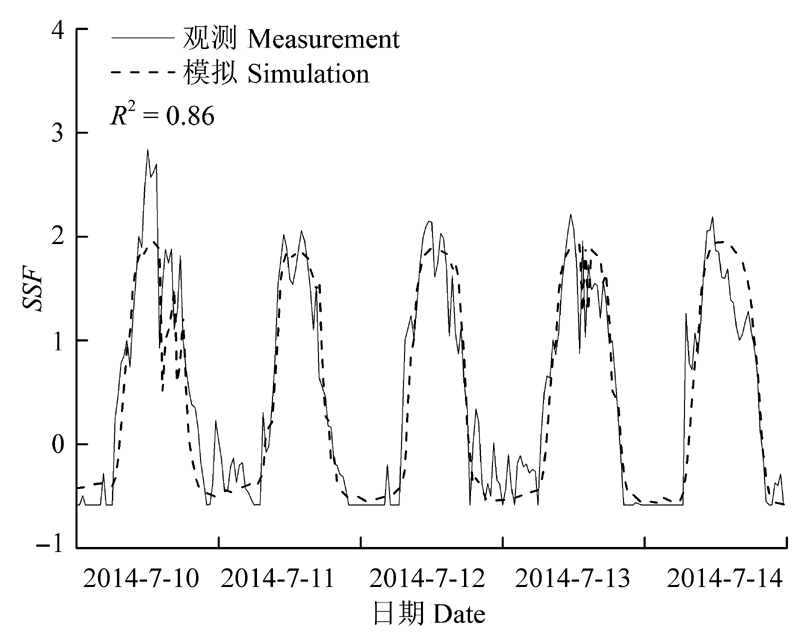
图6 典型晴天液流密度模拟。SSF, 标准化液流密度。
Fig. 6 Simulation of sap flow density in typical sunny days. SSF, standard sap flow density.
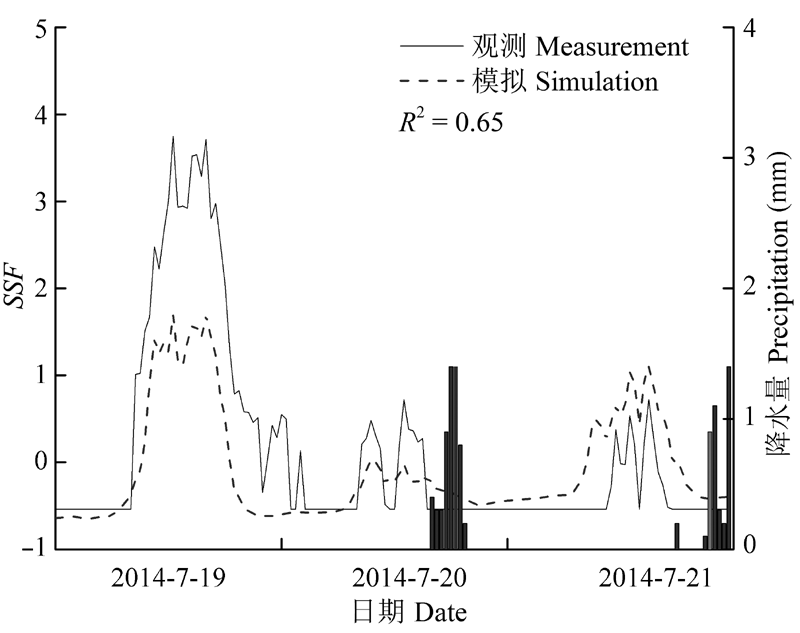
图7 降水天气液流密度模拟。SSF, 标准化液流密度。
Fig. 7 Simulation of sap flow density in typical rainy days. SSF, standard sap flow density.
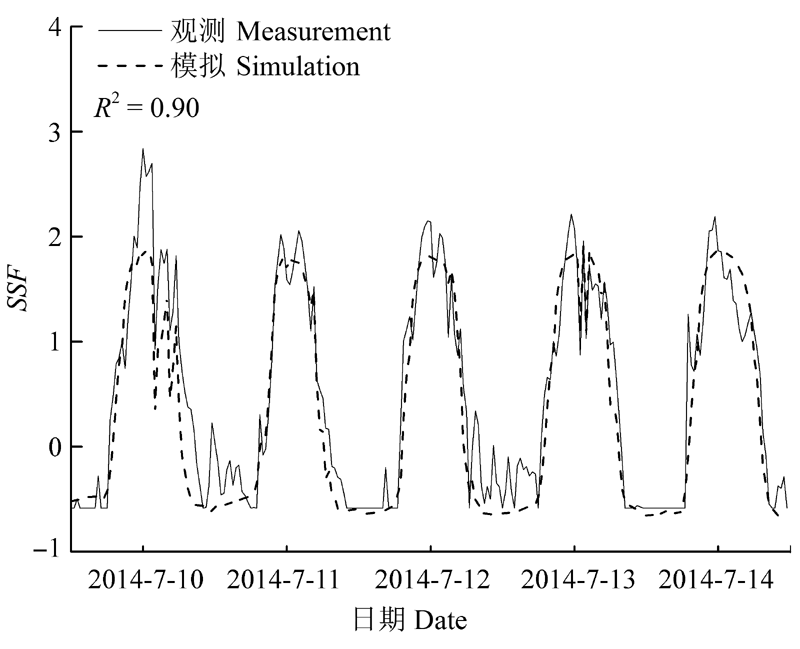
图8 考虑时滞效应的液流密度模拟。SSF, 标准化液流密度。
Fig. 8 Simulation of sap flow density including sap flow lags. SSF, standard sap flow density.
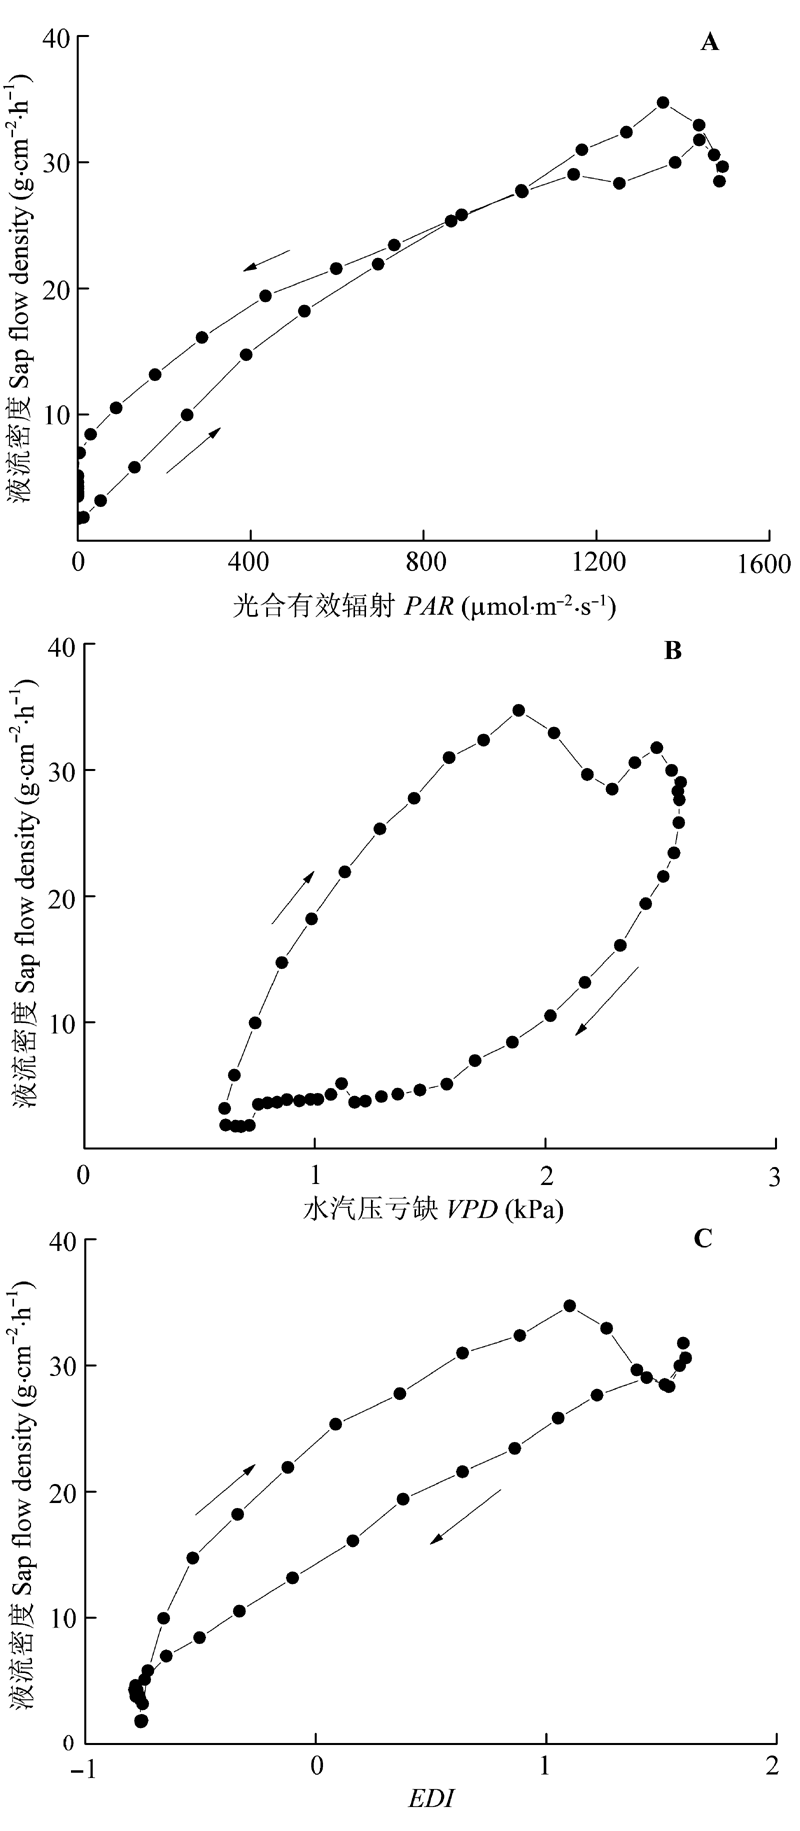
图9 液流密度对光合有效辐射(PAR)(A)、水汽压亏缺(VPD)(B)和蒸腾需求指数(EDI)(C)的非对称响应。
Fig. 9 Hysteresis between sap flow density and photosynthetically active radiation (PAR)(A), vapour pressure deficit (VPD)(B), evaporative demand index (EDI)(C) .
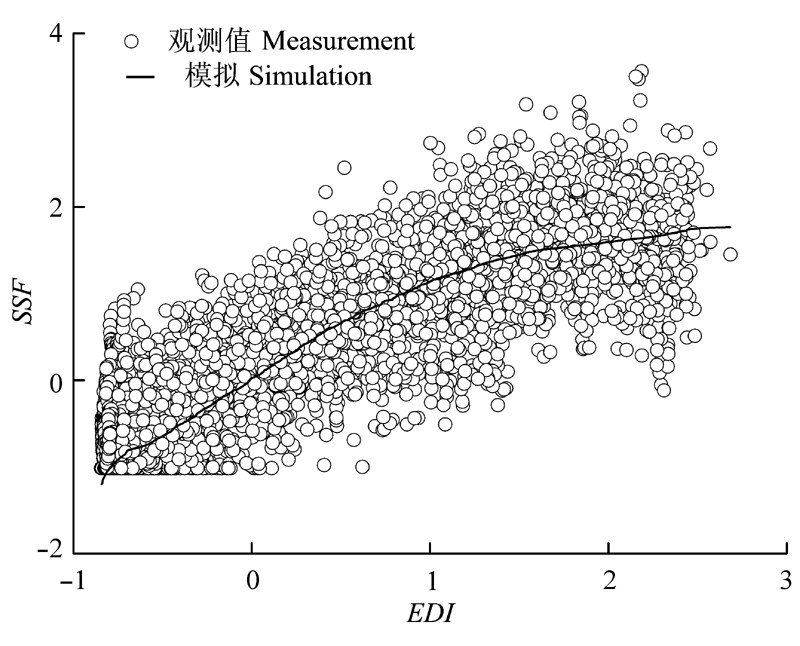
图10 液流密度观测值和模拟值与蒸腾需求指数(EDI)的关系。
Fig. 10 Plots of sap flow density observed and simulated against evaporative demand index (EDI).
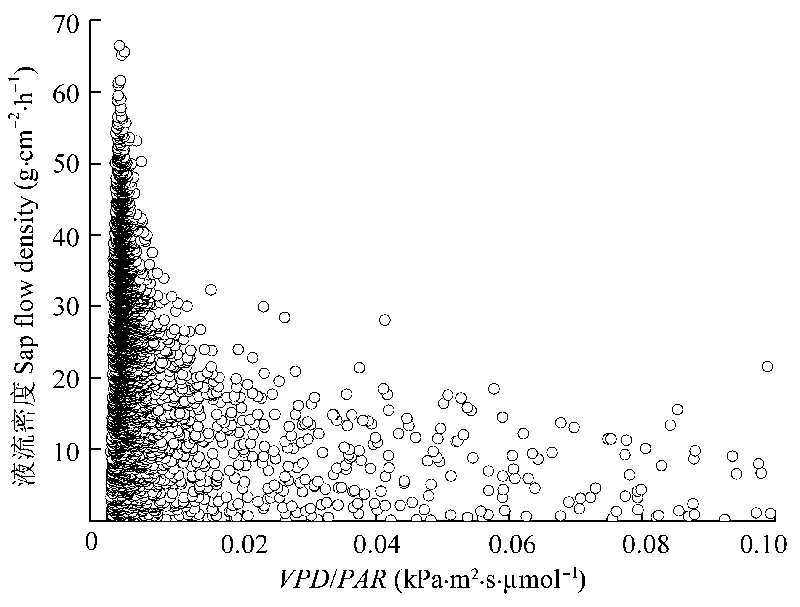
图11 液流密度同标准化水汽压亏缺(VPD/PAR)的关系。
Fig. 11 Sap flow density in relation to vapour pressure deficit (VPD) normalized by photosynthetically active radiation (PAR).
| [1] | Andrade JL, Meinzer FC, Goldstein G, Holbrook NM, Cavelier J, Jackson P, Silvera K (1998). Regulation of water flux through trunks, branches, and leaves in trees of a lowland tropical forest.Oecologia, 115, 463-471. |
| [2] | Arneth A, Kelliher FM, Bauer G, Hollinger DY, Byers JN, Hunt JE, Mcseveny TM, Ziegler W, Vygodskaya NN, Milukova I, Sovachov A, Varlagin A, Schulze E-D (1996). Environmental regulation of xylem sap flow and total conductance of Larix gmelinii trees in eastern Siberia.Tree Physiology, 16, 247-255. |
| [3] | Baker JM, van Bavel CHM (1987). Measurement of mass flow of water in the stems of herbaceous plants.Plant, Cell & Environment, 10, 777-782. |
| [4] | Čermák J, Deml J, Penka M (1973). A new method of sap flow determination in trees.Biologia Plantrum, 15, 171-178. |
| [5] | Chang XX, Zhao WZ, Zhang ZH (2007). Water consumption characteristic of Haloxylon ammodendron for sand binding in desert area.Acta Ecologica Sinica, 27, 1826-1837.(in Chines with English abstract) |
| [常学向, 赵文智, 张智慧 (2007). 荒漠区固沙植物梭梭(Haloxylon ammodendron)耗水特征. 生态学报, 27, 1826-1837.] | |
| [6] | Chuang YL, Oren R, Bertozzi AL, Phillips N, Katul GG (2006). The porous media model for the hydraulic system of a conifer tree: Linking sap flux data to transpiration rate.Ecological Modelling, 191, 447-468. |
| [7] | Dai Y, Zheng XJ, Tang LS, Li Y (2014). Dynamics of water usage in Haloxylon ammodendron in the southern edge of the Gurbantünggüt Desert.Chinese Journal of Plant Ecology, 38, 1214-1225.(in Chinese with English abstract) |
| [戴岳, 郑新军, 唐立松, 李彦 (2014). 古尔班通古特沙漠南缘梭梭水分利用动态. 植物生态学报, 38, 1214-1225.] | |
| [8] | Edwards WRN, Becker P, Èermák J (1996). A unified nomenclature for sap flow measurements.Tree Physiology, 17, 65-67. |
| [9] | Ford CR, Goranson CE, Mitchell BJ, Will RE, Teskey RO (2004). Diurnal and seasonal variability in the radial distribution of sap flow: Predicting total stem flow in Pinus taeda trees.Tree Physiology, 24, 951-960. |
| [10] | Goldstein G, Andrade JL, Meinzer FC, Holbrook NM, Cavelier J, Jackson P, Celis A (1998). Stem water storage and diurnal patterns of water use in tropical forest canopy trees. Plant, Cell & Environment, 21, 397-406. |
| [11] | Granier A (1985). A new method of sap flow measurement in tree stems.Annales of Forest Science, 42, 193-200. |
| [12] | Granier A (1987). Evaluation of transpiration in a Douglas fir stand by means of sap flow measurements.Tree Physiology, 3, 309-320. |
| [13] | Granier A, Bimn P, Lemoine D (2000). Water balance, transpiration and canopy conductance in two beech stands.Agricultural and Forest Meteorology, 100, 291-308. |
| [14] | Granier A, Huc R, Colin F (1992). Transpiration and stomatal conductance of two rain forest species growing in plantations (Simarouba amara and Goupia glabra) in French Guyana.Annals of Forest Science, 49, 17-24. |
| [15] | Guo QS, Tan DY, Liu YJ, Wang CL (2004). Advance in studies of Haloxylon Bunge’s mechanism of adapation and resistance to drought.Forest Research, 17, 796-803.(in Chinese with English abstract) |
| [郭泉水, 谭德远, 刘玉军, 王春玲 (2004). 梭梭对干旱的适应及抗旱机理研究进展. 林业科学研究, 17, 796-803.] | |
| [16] | Hall RL, Allen SJ, Rosier PTW, Hopkins R (1998). Transpiration from coppiced poplar and willow measured using sap-flow methods.Agricultural and Forest Meteorology, 90, 275-290. |
| [17] | Huang DW, Zhang DQ, Zhou GY, Liu SZ, Dennis O, Li YL (2012). Characteristics of dominant tree species stem sap flow and their relationships with environmental factors in a mixed conifer-broadleaf forest in Dinghushan, Guangdong Province of South China.Chinese Journal of Applied Ecology, 23, 1159-1166.(in Chinese with English abstract) |
| [黄德卫, 张德强, 周国逸, 刘世忠, Dennis O, 李跃林 (2012). 鼎湖山针阔叶混交林优势种树干液流特征及其与环境因子的关系. 应用生态学报, 23, 1159-1166.] | |
| [18] | Jarvis PG (1976). The interpretation of the variations in leaf water potential and stomatal conductance found in canopies in the field.Philosophical Transactions of the Royal Society of London Series B-Biological Sciences, 273, 593-610. |
| [19] | Jiang GM (2007). Plant Physioecology. 3rd edn. Higher Education Press, Beijing.(in Chinese) |
| [蒋高明 (2007). 植物生理生态学. 第三版. 高等教育出版社, 北京.] | |
| [20] | Jones HG (1983). Plants and Microclimate. 2nd edn. Cambridge University Press, Cambridge, UK. |
| [21] | Kigalu JM (2007). Effects of planting density on the productivity and water use of tea (Camellia sinensis L.) clones: I. Measurement of water use in young tea using sap flow meters with a stem heat balance method.Agricultural Water Management, 90, 224-232. |
| [22] | Köstner B, Granier A, Cermák J (1998). Sapflow measurements in forest stands: Methods and uncertainties.Annals of Forest Science, 55, 13-27. |
| [23] | Kumagai T, Aoki S, Otsuki K, Utsumi Y (2009). Impact of stem water storage on diurnal estimates of whole-tree transpiration and canopy conductance from sap flow measurements in Japanese cedar and Japanese cypress trees.Hydrological Processes, 23, 2335-2344. |
| [24] | Li XY, Zhang XM, He XY, Zeng FJ, Foetaki A, Thoms FM (2004). Water relation characteristics of four perennial plant species growing in the transition zone between oasis and open desert.Acta Ecologica Sinica, 24, 1164-1171.(in Chinese with English abstract) |
| [李向义, 张希明, 何兴元, 曾凡江, Foetzki A, Thomas FM (2004). 沙漠-绿洲过渡带四种多年生植物水分关系特征. 生态学报, 24, 1164-1171.] | |
| [25] | McDowell NG, White S, Pockman WT (2008). Transpiration and stomatal conductance across a steep climate gradient in the southern Rocky Mountains.Ecohydrology, 1, 193-204. |
| [26] | Meinzer FC, Goldstein G, Andrade JL (2001). Regulation of water flux through tropical forest canopy trees: Do universal rules apply?Tree Physiology, 21, 19-26. |
| [27] | Meinzer FC, Goldstein G, Jackson P, Holbrook NM. Gutiérrez MV, Cavelier J (1995). Environmental and physiological regulation of transpiration in tropical forest gap species: The influence of boundary layer and hydraulic properties.Oecologia, 101, 514-522. |
| [28] | Meinzer FC, Hinckley TM, Ceulemans R (1997). Apparent responses of stomata to transpiration and humidity in a hybrid poplar canopy.Plant, Cell & Environment, 20, 1301-1308. |
| [29] | Motzer T, Munz N, Küppers M, Schmitt D, Anhuf D (2005). Stomatal conductance, transpiration and sap flow of tropical montane rain forest trees in the southern Ecuadorian Andes.Tree Physiology, 25, 1283-1293. |
| [30] | O’Brien JJ, Oberbauer SF, Clark DB (2004). Whole tree xylem sap flow responses to multiple environmental variables in a wet tropical forest.Plant, Cell & Environment, 27, 551-567. |
| [31] | Oguntunde PG (2005). Whole-plant water use and canopy conductance of cassava under limited available soil water and varying evaporative demand.Plant and Soil, 278, 371-383. |
| [32] | Oren R, Phillips N, Ewers BE, Pataki DE, Megonigal JP (1999). Sap-flux-scaled transpiration responses to light, vapor pressure deficit, and leaf area reduction in a flooded Taxodium distichum forest.Tree Physiology, 19, 337-347. |
| [33] | Ortuño MF, García-Orellana Y, Conejero W, Ruiz-Sánchez MC, Mounzer O, Alarcón JJ, Torresillas A (2006). Relationships between climatic variables and sap flow, stem water potential and maximum daily trunk shrinkage in lemon trees.Plant and Soil, 279, 229-242. |
| [34] | Phillips NG, Ryan MG, Bond BJ, McDowell NG, Hinckley TM, Čermák J (2003). Reliance on stored water increases with tree size in three species in the Pacific Northwest.Tree Physiology, 23, 237-145. |
| [35] | Schulze E-D, Čermák J, Matyssek M, Penka M, Zummermann R, Vasícek F, Gries W, Kučera J (1985). Canopy transpiration and water fluxes in the xylem of the trunk of Larix and Picea trees — A comparison of xylem flow, porome- ter and cuvette measurements.Oecologia, 66, 475-483. |
| [36] | Smith DM, Allen SJ (1996). Measurement of sap flow in plant stems.Journal of Experimental Botany, 47, 1833-1844. |
| [37] | Stöhr A, Lösch R (2004). Xylem sap flow and drought stress of Fraxinus excelsior saplings.Tree Physiology, 24, 169-180. |
| [38] | Su PX, An LZ, Ma RJ, Liu XM (2005). Kranz anatomy and C4 photosynthetic characteristics of two desert plants, Haloxylon ammodendron and Calligonum mongolicum.Acta Phytoecologica Sinica, 29, 1-7.(in Chinese with English abstract) |
| [苏培玺, 安黎哲, 马瑞君, 刘新民 (2005). 荒漠植物梭梭和沙拐枣的花环结构及C4光合特征. 植物生态学报, 29, 1-7.] | |
| [39] | Su PX, Yan QD (2006). Photosynthetic characteristics of C4 desert species Haloxylon ammodendron and Calligonum mongolicum under different moisture conditions.Acta Ecologica Sinica, 26, 75-82.(in Chinese with English Abstract) |
| [苏培玺, 严巧娣 (2006). C4荒漠植物梭梭和沙拐枣在不同水分条件下的光合作用特征. 生态学报, 26, 75-82.] | |
| [40] | Tan YQ, Bo XF, Zhu JJ, Wang ZL, Liu LD (2011). An analysis on the water status in twigs and its relations to the drought resistance in five woody plants living in arid zone.Acta Ecologica Sinica, 31, 6815-6823.(in Chinese with English abstract) |
| [谭永芹, 柏新富, 朱建军, 王仲礼, 刘林德 (2011). 干旱区五种木本植物枝叶水分状况与其抗旱性能. 生态学报, 31, 6815-6823.] | |
| [41] | Verbeeck H, Steppe K, Nadezhdina N, Op De Beeck M, Deckmyn G, Meiresonne L, Lemeur R, Čermák J, Ceulemans R, Janssens IA (2007). Model analysis of the effects of atmospheric drivers on storage water use in Scots Pine.Biogeosciences, 4, 657-671. |
| [42] | Vertessy RA, Benyon RG, O’Sullivan SK, Gribben PR (1995). Relationships between stem diameter, sapwood area, leaf area and transpiration in a young mountain ash forest.Tree Physiology, 15, 559-567. |
| [43] | Wang H, Zhao P, Cai XA, Ma L, Rao XQ, Zeng XP (2008). Time lag effect between stem sap flow and photosynthetically active radiation, vapor pressure deficit of Acacia mangium.Chinese Journal of Applied Ecology, 19, 225-230.(in Chinese with English abstract) |
| [王华, 赵平, 蔡锡安, 马玲, 饶兴权, 曾小平 (2008). 马占相思树干液流与光合有效辐射和水汽压亏缺间的时滞效应. 应用生态学报, 19, 225-230.] | |
| [44] | Wang HM, Sun W, Zu YG, Wang WJ (2011). Complexity and its integrative effects of the time lags of environment factors affecting Larix gmelinii stem sap flow.Chinese Journal of Applied Ecology, 22, 3109-3116.(in Chinese with English abstract) |
| [王慧梅, 孙伟, 祖元刚, 王文杰 (2011). 不同环境因子对兴安落叶松树干液流的时滞效应复杂性及其综合影响. 应用生态学报, 22, 3109-3116.] | |
| [45] | Wullschleger SD, King AW (2000). Radial variation in sap velocity as a function of stem diameter and sapwood thick- ness in yellow-poplar trees.Tree Physiology, 20, 511-518. |
| [46] | Wullschleger SD, Meinzer FC, Vertessy RA (1998). A review of whole-plant water use studies in tree.Tree Physiology, 18, 499-512. |
| [47] | Xu F, Yang FT, Wang HM, Dai XQ (2012). Review of advances in radial patterns of stem sap flow.Chinese Journal of Plant Ecology, 36, 1004-1014.(in Chinese with English abstract) |
| [徐飞, 杨风婷, 王辉民, 戴小琴(2012). 树干液流径向分布格局研究进展. 植物生态学报, 36, 1004-1014.] | |
| [48] | Yi LP, Ma J, Li Y (2007). The comparisons of root system and root hair morphological characteristics among three desert halophytes.Bulletin of Botanical Research, 27, 204-211.(in Chinese with English abstract) |
| [弋良朋, 马健, 李彦 (2007). 3种荒漠盐生植物根系及根毛形态特征的比较研究. 植物研究, 27, 204-211.] | |
| [49] | Zeppel M, Macinnis-Ng CMO, Ford CR, Eamus D (2008). The response of sap flow to pulses of rain in a temperate Australian woodland.Plant and Soil, 305, 121-130. |
| [1] | 胡妍, 李林, 魏识广, 阴宇航, 周景钢, 钟建军, 王雪. 喀斯特地区30种灌木不同序级根系性状及其根经济谱研究[J]. 植物生态学报, 2025, 49(12): 1991-2003. |
| [2] | 吴茹茹, 刘美珍, 谷仙, 常馨月, 郭立月, 蒋高明, 祁如意. 气候变化对巨柏适宜生境分布的潜在影响和预测[J]. 植物生态学报, 2024, 48(4): 445-458. |
| [3] | 郭敏, 罗林, 梁进, 王彦杰, 赵春章. 冻融变化对西南亚高山森林优势种云杉和华西箭竹根区土壤理化性质与酶活性的影响[J]. 植物生态学报, 2023, 47(6): 882-894. |
| [4] | 陈奕竹, 郎伟光, 陈效逑. 中国北方树木秋季物候的过程模拟及其区域分异归因[J]. 植物生态学报, 2022, 46(7): 753-765. |
| [5] | 程思祺, 姜峰, 金光泽. 温带森林阔叶植物幼苗叶经济谱及其与防御性状的关系[J]. 植物生态学报, 2022, 46(6): 678-686. |
| [6] | 孙文泰, 马明. 黄土高原长期覆膜苹果园土壤物理退化与细根生长响应[J]. 植物生态学报, 2021, 45(9): 972-986. |
| [7] | 董琳琳, 普晓妍, 张璐璐, 宋亮, 鲁志云, 李苏. 亚热带森林附生地衣压力-体积曲线分析及其适用性[J]. 植物生态学报, 2021, 45(3): 274-285. |
| [8] | 魏春雪, 杨璐, 汪金松, 杨家明, 史嘉炜, 田大栓, 周青平, 牛书丽. 实验增温对陆地生态系统根系生物量的影响[J]. 植物生态学报, 2021, 45(11): 1203-1212. |
| [9] | 闫涵, 张云玲, 马松梅, 王春成, 张丹. 黑果枸杞在新疆的适宜分布模拟与局部环境适应性分化[J]. 植物生态学报, 2021, 45(11): 1221-1230. |
| [10] | 朱彪, 陈迎. 陆地生态系统野外增温控制实验的技术与方法[J]. 植物生态学报, 2020, 44(4): 330-339. |
| [11] | 李旭, 吴婷, 程严, 谭钠丹, 蒋芬, 刘世忠, 褚国伟, 孟泽, 刘菊秀. 南亚热带常绿阔叶林4个树种对增温的生理生态适应能力比较[J]. 植物生态学报, 2020, 44(12): 1203-1214. |
| [12] | 闫鹏飞, 展鹏飞, 肖德荣, 王燚, 余瑞, 刘振亚, 王行. 模拟增温及分解界面对茭草凋落物分解速率及叶际微生物结构和功能的影响[J]. 植物生态学报, 2019, 43(2): 107-118. |
| [13] | 董正武, 赵英, 雷加强, 喜银巧. 塔克拉玛干沙漠不同区域柽柳沙包土壤盐分分布特征及其影响因素[J]. 植物生态学报, 2018, 42(8): 873-884. |
| [14] | 宋小艳, 王根绪, 冉飞, 杨燕, 张莉, 肖瑶. 东北大兴安岭演替初期泰加林灌草层典型植物开花物候与生长对模拟暖干化气候的响应[J]. 植物生态学报, 2018, 42(5): 539-549. |
| [15] | 刘晓, 戚超, 闫艺兰, 袁国富. 不同生态系统水分利用效率指标在黄土高原半干旱草地应用的适宜性评价[J]. 植物生态学报, 2017, 41(5): 497-505. |
| 阅读次数 | ||||||
|
全文 |
|
|||||
|
摘要 |
|
|||||
Copyright © 2026 版权所有 《植物生态学报》编辑部
地址: 北京香山南辛村20号, 邮编: 100093
Tel.: 010-62836134, 62836138; Fax: 010-82599431; E-mail: apes@ibcas.ac.cn, cjpe@ibcas.ac.cn
备案号: 京ICP备16067583号-19
![]()