
植物生态学报 ›› 2020, Vol. 44 ›› Issue (11): 1113-1126.DOI: 10.17521/cjpe.2020.0111 cstr: 32100.14.cjpe.2020.0111
所属专题: 美丽中国建设
张文强1,2, 罗格平1,2,3,*( ), 郑宏伟1,2, 王浩4, HAMDI Rafiq1,5,6, 何惠丽1,2, 蔡鹏1,2, 陈春波1,2
收稿日期:2020-04-20
接受日期:2020-06-02
出版日期:2020-11-20
发布日期:2020-07-07
作者简介:*luogp@ms.xjb.ac.cn基金资助:
ZHANG Wen-Qiang1,2, LUO Ge-Ping1,2,3,*(), ZHENG Hong-Wei1,2, WANG Hao4, HAMDI Rafiq1,5,6, HE Hui-Li1,2, CAI Peng1,2, CHEN Chun-Bo1,2
Received:2020-04-20
Accepted:2020-06-02
Online:2020-11-20
Published:2020-07-07
Supported by:摘要:
全球变化背景下的干旱区植被变化受气候变化和人类活动双重影响。定量评价植被变化特征及其驱动机制, 对监测干旱区区域生态环境变化, 促进区域可持续发展有重要意义。由于复杂多样的人类活动难以量化, 有关这方面的研究多局限于植被对气候变化的响应, 而对人类活动影响考虑不足, 导致关于这方面的认识存在较大的偏差和不确定性。该文首先提出与土地利用相关的人类活动量化表征方法; 然后运用多元线性回归模型和随机森林模型中的较优模型, 分析气候变化和具体的人类活动对北天山北坡中段归一化植被指数(NDVI)的影响。主要结果: (1) 2000-2015年期间北天山北坡中段年NDVI总体呈增加趋势; 基于随机森林构建的NDVI与气候因子和人类活动的模型拟合精度明显优于多元线性回归模型, 其决定系数(R2)至少提高了24%; (2)研究期内与耕地有关的人类活动对北天山北坡中段NDVI分布及时空变化的影响呈增加的特征, 在2000-2015年期间人类活动对NDVI变化的贡献率为0.59, 超过了气候因子。该项研究为气候变化和人类活动对植被的影响研究提供了新思路, 也为干旱区生态环境保护和恢复提供了科学依据。
张文强, 罗格平, 郑宏伟, 王浩, HAMDI Rafiq, 何惠丽, 蔡鹏, 陈春波. 基于随机森林模型的内陆干旱区植被指数变化与驱动力分析: 以北天山北坡中段为例. 植物生态学报, 2020, 44(11): 1113-1126. DOI: 10.17521/cjpe.2020.0111
ZHANG Wen-Qiang, LUO Ge-Ping, ZHENG Hong-Wei, WANG Hao, HAMDI Rafiq, HE Hui-Li, CAI Peng, CHEN Chun-Bo. Analysis of vegetation index changes and driving forces in inland arid areas based on random forest model: a case study of the middle part of northern slope of the north Tianshan Mountains. Chinese Journal of Plant Ecology, 2020, 44(11): 1113-1126. DOI: 10.17521/cjpe.2020.0111
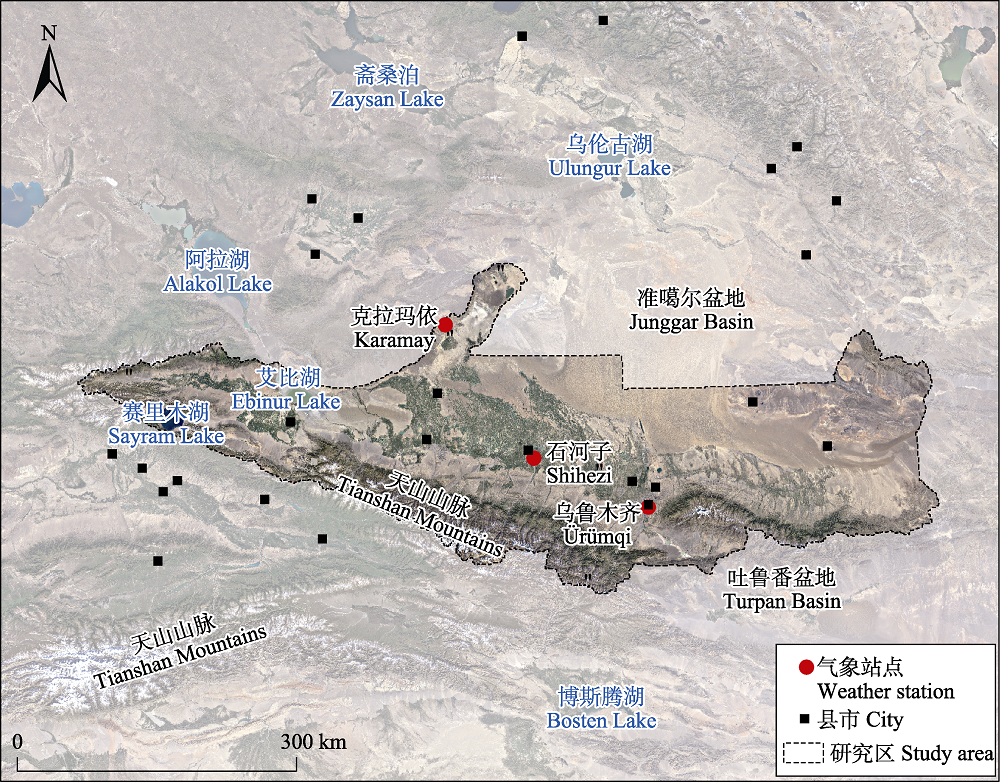
图1 北天山北坡中段研究区气象站点分布。
Fig. 1 Distribution of meteorological stations of the middle part of northern slope of the north Tianshan Mountains.
| 数据 Data | 数据类型 Data type | 空间分辨率 Spatial resolution | 数据时段 Acquisition time | 数据来源 Data source |
|---|---|---|---|---|
| MODIS-NDVI | 栅格 Raster | 1 km | 2000-2015 | https://code.earthengine.google.com |
| Landsat TM/ETM/OLI | 栅格 Raster | 30 m | 2000, 2005, 2010, 2015 | https://earthexplorer.usgs.gov |
| 气象数据 Meteorological data | 站点 Station | - | 2000-2015 | 中国气象科学数据共享服务网(http://data.cma.cn/)、当地气象局 China meteorological data sharing service system (http://data.cma.cn/), local weather bureau |
| 土地利用类型 Land use type | 矢量 Vector | - | 2000, 2005, 2010, 2015 | 中国科学院新疆生态与地理研究所对地观测与系统模拟实验室 Earth observation and systems simulation laboratory, Xinjiang institute of ecology and geography, Chinese Academy of Sciences |
| 放牧数据 Grazing data | 栅格、站点 Raster, station | 0.083 33° | 2000, 2005, 2010, 2015 | 世界粮农组织(FAO)(http://www.fao.org/livestock-systems/en/)、2015年野外实测数据、新疆统计年鉴 Food and Agriculture Organization (http://www.fao.org/livestock-systems/en/), field data in 2015, Xinjiang statistical yearbook |
表1 北天山北坡中段相关数据来源
Table 1 Data source of the middle part of northern slope of the north Tianshan Mountains
| 数据 Data | 数据类型 Data type | 空间分辨率 Spatial resolution | 数据时段 Acquisition time | 数据来源 Data source |
|---|---|---|---|---|
| MODIS-NDVI | 栅格 Raster | 1 km | 2000-2015 | https://code.earthengine.google.com |
| Landsat TM/ETM/OLI | 栅格 Raster | 30 m | 2000, 2005, 2010, 2015 | https://earthexplorer.usgs.gov |
| 气象数据 Meteorological data | 站点 Station | - | 2000-2015 | 中国气象科学数据共享服务网(http://data.cma.cn/)、当地气象局 China meteorological data sharing service system (http://data.cma.cn/), local weather bureau |
| 土地利用类型 Land use type | 矢量 Vector | - | 2000, 2005, 2010, 2015 | 中国科学院新疆生态与地理研究所对地观测与系统模拟实验室 Earth observation and systems simulation laboratory, Xinjiang institute of ecology and geography, Chinese Academy of Sciences |
| 放牧数据 Grazing data | 栅格、站点 Raster, station | 0.083 33° | 2000, 2005, 2010, 2015 | 世界粮农组织(FAO)(http://www.fao.org/livestock-systems/en/)、2015年野外实测数据、新疆统计年鉴 Food and Agriculture Organization (http://www.fao.org/livestock-systems/en/), field data in 2015, Xinjiang statistical yearbook |
| 自变量 Independent variable | 回归系数 Regression coefficient | |||
|---|---|---|---|---|
| 2000 | 2005 | 2010 | 2015 | |
| 年最低气温 Annual minimum temperature | 0.134 | 0.156 | 0.127 | 0.162 |
| 年平均气温 Annual average temperature | -0.160 | -0.139 | -0.122 | -0.245 |
| 年最高气温 Annual maximum temperature | 0.026 | -0.014 | -0.013 | 0.072 |
| 年累计降水量 Annual cumulative precipitation | 0.000 2 | 0.000 3 | 0.000 03 | 0.000 001 |
| 耕地比例 Arable proportion | 0.005 | 0.005 | 0.005 | 0.005 |
| 林地比例 Forest proportion | 0.005 | 0.005 | 0.007 | 0.007 |
| 草地比例 Grassland proportion | 0.002 | 0.001 | 0.001 | 0.001 |
| 水体比例 Water body proportion | -0.001 | -0.001 | -0.001 | -0.002 |
| 城市比例 Urban proportion | 0.003 | 0.002 | 0.002 | 0.002 |
| 荒漠比例 Desert proportion | 0.001 | 0.000 1 | -0.000 4 | -0.000 3 |
| 放牧强度 Grazing intensity | 0.054 | 0.038 | 0.053 | 0.044 |
| 常数项 Constant | 0.617 | 0.983 | 0.981 | 0.634 |
表2 2000-2015年北天山北坡中段研究区归一化植被指数(NDVI)影响因子的多元线性回归系数
Table 2 Regression coefficient of each independent variable of normalized differential vegetation index (NDVI) of the middle part of northern slope of the north Tianshan Mountains from 2000 to 2015
| 自变量 Independent variable | 回归系数 Regression coefficient | |||
|---|---|---|---|---|
| 2000 | 2005 | 2010 | 2015 | |
| 年最低气温 Annual minimum temperature | 0.134 | 0.156 | 0.127 | 0.162 |
| 年平均气温 Annual average temperature | -0.160 | -0.139 | -0.122 | -0.245 |
| 年最高气温 Annual maximum temperature | 0.026 | -0.014 | -0.013 | 0.072 |
| 年累计降水量 Annual cumulative precipitation | 0.000 2 | 0.000 3 | 0.000 03 | 0.000 001 |
| 耕地比例 Arable proportion | 0.005 | 0.005 | 0.005 | 0.005 |
| 林地比例 Forest proportion | 0.005 | 0.005 | 0.007 | 0.007 |
| 草地比例 Grassland proportion | 0.002 | 0.001 | 0.001 | 0.001 |
| 水体比例 Water body proportion | -0.001 | -0.001 | -0.001 | -0.002 |
| 城市比例 Urban proportion | 0.003 | 0.002 | 0.002 | 0.002 |
| 荒漠比例 Desert proportion | 0.001 | 0.000 1 | -0.000 4 | -0.000 3 |
| 放牧强度 Grazing intensity | 0.054 | 0.038 | 0.053 | 0.044 |
| 常数项 Constant | 0.617 | 0.983 | 0.981 | 0.634 |
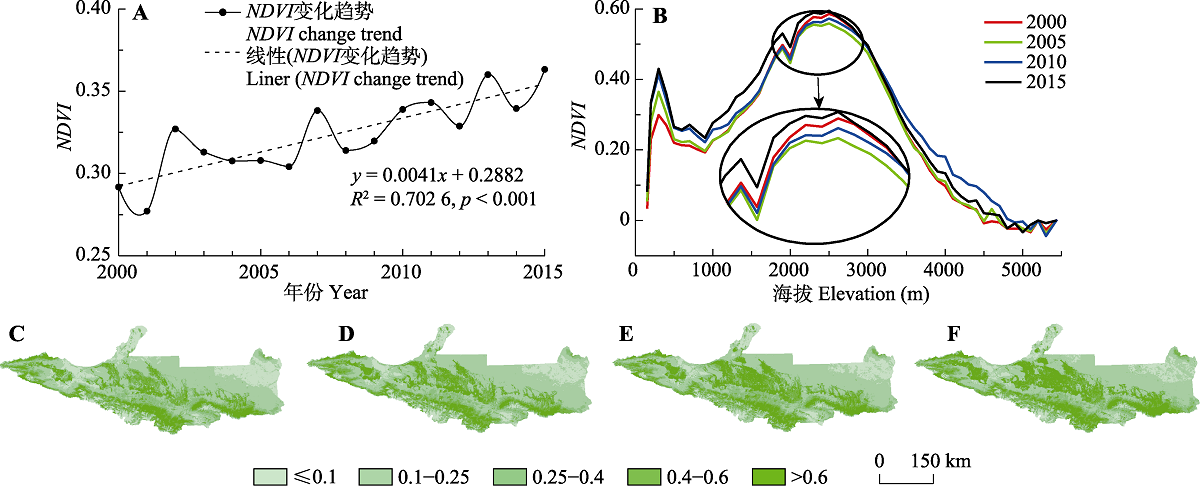
图2 2000-2015年北天山北坡中段年最大归一化植被指数(NDVI)趋势变化(A), NDVI随海拔变化趋势(B)以及2000 (C)、2005 (D)、2010 (E)和2015年(F)的NDVI空间分布。
Fig. 2 Changes in maximum normalized differential vegetation index (NDVI) trend of the middle part of northern slope of the north Tianshan Mountains from 2000 to 2015 (A), changes in NDVI with altitude (B), and NDVI spatial distribution in 2000 (C), 2005 (D), 2010 (E), and 2015 (F).
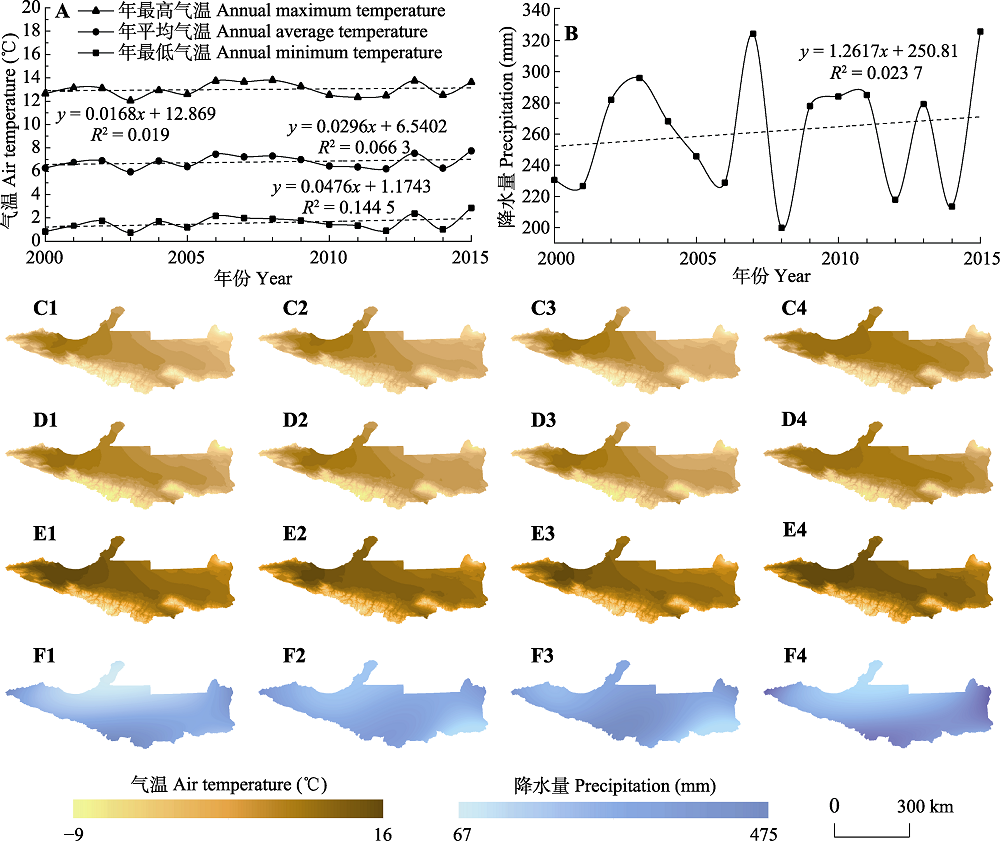
图3 2000-2015年北天山北坡中段研究区站点气候因素趋势变化。A, 温度。B, 降水。C-F, 年最低气温(C)、年平均气温(D)、年最高气温(E)和年累计降水量(F)在2000 (1)、2005 (2)、2010 (3)、2015年(4)的空间分布。
Fig. 3 Changes of climatic factors of study area of the middle part of northern slope of the north Tianshan Mountains from 2000 to 2015. A, Temperature. B, Precipitation. Interpolation results of annual minimum temperature (C), annual average temperature (D), annual maximum temperature (E), and annual cumulative precipitation (F) in 2000 (1), 2005 (2), 2010 (3) and 2015 (4).
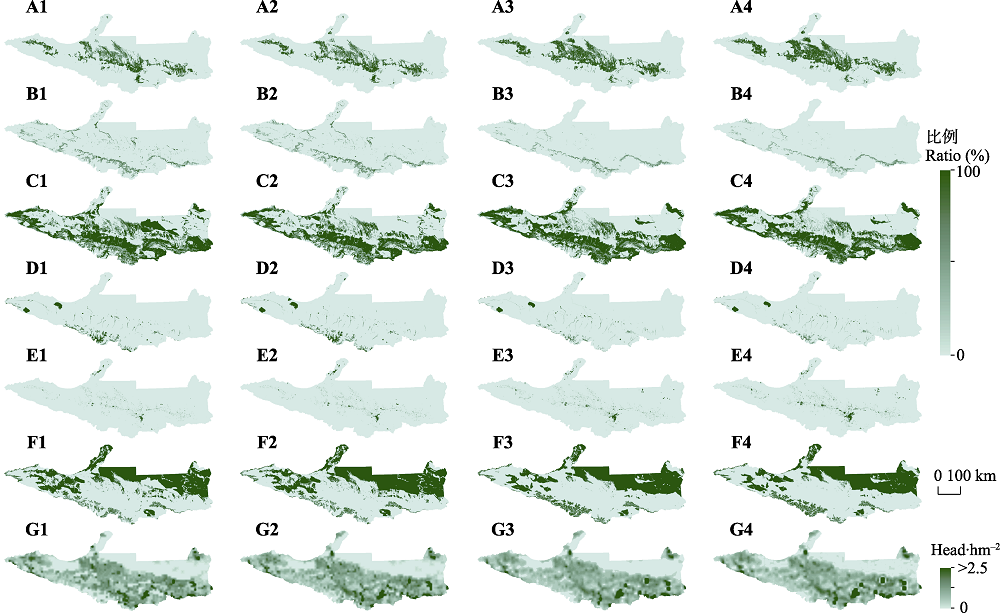
图4 北天山北坡中段耕地(A)、林地(B)、草地(C)、水体(D)、城市(E)和荒漠(F)在每个像元中所占面积比例与放牧强度(G)在2000 (1)、2005 (2)、2010 (3)和2015年(4)的空间分布。放牧强度数据来源于国际粮农组织(FAO)。
Fig. 4 Proportion of arable lands (A), forest (B), grassland (C),water body (D), urban (E) and desert (F) in each pixel and grazing intensity (G) spatial distribution in the study area of the middle part of northern slope of the north Tianshan Mountains in 2000 (1), 2005 (2), 2010 (3) and 2015 (4). Grazing intensity data comes from Food and Agriculture Organization of the United Nations (FAO).
| 2000 | 2005 | 总计 Total | |||||
|---|---|---|---|---|---|---|---|
| 耕地 Arable | 林地 Forest | 草地 Grassland | 水体 Water body | 城市 Urban | 荒漠 Desert | ||
| 耕地 Arable | 1.568 8 | 0.003 8 | 0.040 9 | 0.001 1 | 0.010 1 | 0.021 6 | 1.646 3 |
| 林地 Forest | 0.017 9 | 0.592 0 | 0.017 3 | 0.000 5 | 0.001 7 | 0.001 9 | 0.631 3 |
| 草地 Grassland | 0.140 3 | 0.004 9 | 5.606 3 | 0.005 5 | 0.006 8 | 0.534 3 | 6.298 1 |
| 水体 Water body | 0.001 3 | 0.000 1 | 0.003 8 | 0.489 3 | 0.000 4 | 0.005 0 | 0.499 9 |
| 城市 Urban | 0.006 2 | 0.000 1 | 0.002 3 | 0.000 2 | 0.147 9 | 0.000 9 | 0.157 6 |
| 荒漠 Desert | 0.056 6 | 0.001 5 | 0.027 6 | 0.017 7 | 0.011 6 | 5.558 6 | 5.673 6 |
| 总计 Total | 1.791 1 | 0.602 4 | 5.698 2 | 0.514 3 | 0.178 5 | 6.122 3 | 14.906 8 |
表3 2000-2005年北天山北坡中段土地利用转移矩阵(万km2)
Table 3 Land use transition matrix of the middle part of northern slope of the north Tianshan Mountains from 2000 to 2005 (104 km2)
| 2000 | 2005 | 总计 Total | |||||
|---|---|---|---|---|---|---|---|
| 耕地 Arable | 林地 Forest | 草地 Grassland | 水体 Water body | 城市 Urban | 荒漠 Desert | ||
| 耕地 Arable | 1.568 8 | 0.003 8 | 0.040 9 | 0.001 1 | 0.010 1 | 0.021 6 | 1.646 3 |
| 林地 Forest | 0.017 9 | 0.592 0 | 0.017 3 | 0.000 5 | 0.001 7 | 0.001 9 | 0.631 3 |
| 草地 Grassland | 0.140 3 | 0.004 9 | 5.606 3 | 0.005 5 | 0.006 8 | 0.534 3 | 6.298 1 |
| 水体 Water body | 0.001 3 | 0.000 1 | 0.003 8 | 0.489 3 | 0.000 4 | 0.005 0 | 0.499 9 |
| 城市 Urban | 0.006 2 | 0.000 1 | 0.002 3 | 0.000 2 | 0.147 9 | 0.000 9 | 0.157 6 |
| 荒漠 Desert | 0.056 6 | 0.001 5 | 0.027 6 | 0.017 7 | 0.011 6 | 5.558 6 | 5.673 6 |
| 总计 Total | 1.791 1 | 0.602 4 | 5.698 2 | 0.514 3 | 0.178 5 | 6.122 3 | 14.906 8 |
| 2000 | 2010 | 总计 Total | |||||
|---|---|---|---|---|---|---|---|
| 耕地 Arable | 林地 Forest | 草地 Grassland | 水体 Water body | 城市 Urban | 荒漠 Desert | ||
| 耕地 Arable | 1.463 0 | 0.003 5 | 0.117 6 | 0.005 0 | 0.052 1 | 0.005 2 | 1.646 4 |
| 林地 Forest | 0.057 8 | 0.208 3 | 0.332 1 | 0.003 9 | 0.004 5 | 0.023 9 | 0.630 5 |
| 草地 Grassland | 0.511 1 | 0.095 7 | 4.663 2 | 0.028 6 | 0.041 5 | 0.956 1 | 6.296 2 |
| 水体 Water body | 0.007 1 | 0.000 4 | 0.050 0 | 0.224 0 | 0.001 7 | 0.216 8 | 0.500 0 |
| 城市 Urban | 0.035 5 | 0.000 2 | 0.009 5 | 0.000 2 | 0.100 1 | 0.012 2 | 0.157 7 |
| 荒漠 Desert | 0.215 4 | 0.004 2 | 1.047 6 | 0.035 9 | 0.027 4 | 4.342 1 | 5.672 6 |
| 总计 Total | 2.289 9 | 0.312 3 | 6.220 0 | 0.297 6 | 0.227 3 | 5.556 3 | 14.903 4 |
表4 2000-2010年北天山北坡中段土地利用转移矩阵(万km2)
Table 4 Land use transition matrix of the middle part of northern slope of the north Tianshan Mountains from 2000 to 2010 (104 km2)
| 2000 | 2010 | 总计 Total | |||||
|---|---|---|---|---|---|---|---|
| 耕地 Arable | 林地 Forest | 草地 Grassland | 水体 Water body | 城市 Urban | 荒漠 Desert | ||
| 耕地 Arable | 1.463 0 | 0.003 5 | 0.117 6 | 0.005 0 | 0.052 1 | 0.005 2 | 1.646 4 |
| 林地 Forest | 0.057 8 | 0.208 3 | 0.332 1 | 0.003 9 | 0.004 5 | 0.023 9 | 0.630 5 |
| 草地 Grassland | 0.511 1 | 0.095 7 | 4.663 2 | 0.028 6 | 0.041 5 | 0.956 1 | 6.296 2 |
| 水体 Water body | 0.007 1 | 0.000 4 | 0.050 0 | 0.224 0 | 0.001 7 | 0.216 8 | 0.500 0 |
| 城市 Urban | 0.035 5 | 0.000 2 | 0.009 5 | 0.000 2 | 0.100 1 | 0.012 2 | 0.157 7 |
| 荒漠 Desert | 0.215 4 | 0.004 2 | 1.047 6 | 0.035 9 | 0.027 4 | 4.342 1 | 5.672 6 |
| 总计 Total | 2.289 9 | 0.312 3 | 6.220 0 | 0.297 6 | 0.227 3 | 5.556 3 | 14.903 4 |
| 2000 | 2015 | 总计 Total | |||||
|---|---|---|---|---|---|---|---|
| 耕地 Arable | 林地 Forest | 草地 Grassland | 水体 Water body | 城市 Urban | 荒漠 Desert | ||
| 耕地 Arable | 1.442 8 | 0.003 2 | 0.114 7 | 0.004 7 | 0.076 4 | 0.004 6 | 1.646 4 |
| 林地 Forest | 0.064 9 | 0.208 0 | 0.324 1 | 0.004 0 | 0.005 6 | 0.023 8 | 0.630 4 |
| 草地 Grassland | 0.612 9 | 0.095 7 | 4.538 3 | 0.028 2 | 0.068 6 | 0.952 4 | 6.296 1 |
| 水体 Water body | 0.007 7 | 0.000 4 | 0.049 8 | 0.222 9 | 0.002 3 | 0.216 9 | 0.500 0 |
| 城市 Urban | 0.034 2 | 0.000 2 | 0.008 5 | 0.000 3 | 0.102 3 | 0.012 2 | 0.157 7 |
| 荒漠 Desert | 0.281 5 | 0.004 2 | 0.985 1 | 0.036 0 | 0.042 0 | 4.323 7 | 5.672 5 |
| 总计 Total | 2.444 0 | 0.311 7 | 6.0205 | 0.297 2 | 0.297 2 | 5.533 6 | 14.903 1 |
表5 2000-2015年北天山北坡中段土地利用转移矩阵(万km2)
Table 5 Land use transition matrix of the middle part of northern slope of the north Tianshan Mountains from 2000 to 2015 (104 km2)
| 2000 | 2015 | 总计 Total | |||||
|---|---|---|---|---|---|---|---|
| 耕地 Arable | 林地 Forest | 草地 Grassland | 水体 Water body | 城市 Urban | 荒漠 Desert | ||
| 耕地 Arable | 1.442 8 | 0.003 2 | 0.114 7 | 0.004 7 | 0.076 4 | 0.004 6 | 1.646 4 |
| 林地 Forest | 0.064 9 | 0.208 0 | 0.324 1 | 0.004 0 | 0.005 6 | 0.023 8 | 0.630 4 |
| 草地 Grassland | 0.612 9 | 0.095 7 | 4.538 3 | 0.028 2 | 0.068 6 | 0.952 4 | 6.296 1 |
| 水体 Water body | 0.007 7 | 0.000 4 | 0.049 8 | 0.222 9 | 0.002 3 | 0.216 9 | 0.500 0 |
| 城市 Urban | 0.034 2 | 0.000 2 | 0.008 5 | 0.000 3 | 0.102 3 | 0.012 2 | 0.157 7 |
| 荒漠 Desert | 0.281 5 | 0.004 2 | 0.985 1 | 0.036 0 | 0.042 0 | 4.323 7 | 5.672 5 |
| 总计 Total | 2.444 0 | 0.311 7 | 6.0205 | 0.297 2 | 0.297 2 | 5.533 6 | 14.903 1 |
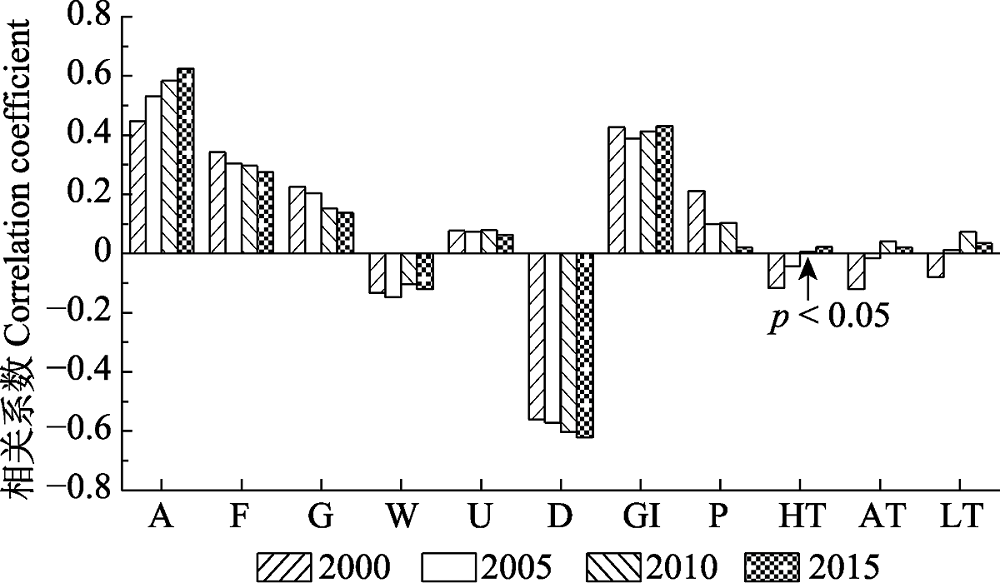
图5 归一化植被指数(NDVI)与影响因子相关分析。A, 耕地比例; AT, 年平均气温; D, 荒漠比例; F, 林地比例; G, 草地比例; GI, 放牧强度; HT, 年最高气温; LT, 年最低气温; P, 年累计降水量; U, 城市比例; W, 水体比例。
Fig. 5 Correlation coefficient between normalized differential vegetation index (NDVI) and impact factors. A, arable proportion; AT, annual average temperature; D, desert proportion; F, forest proportion; G, grassland proportion; GI, grazing intensity; HT, annual maximum temperature; LT, annual minimum temperature; P, annual cumulative precipitation; U, urban proportion; W, water body proportion.
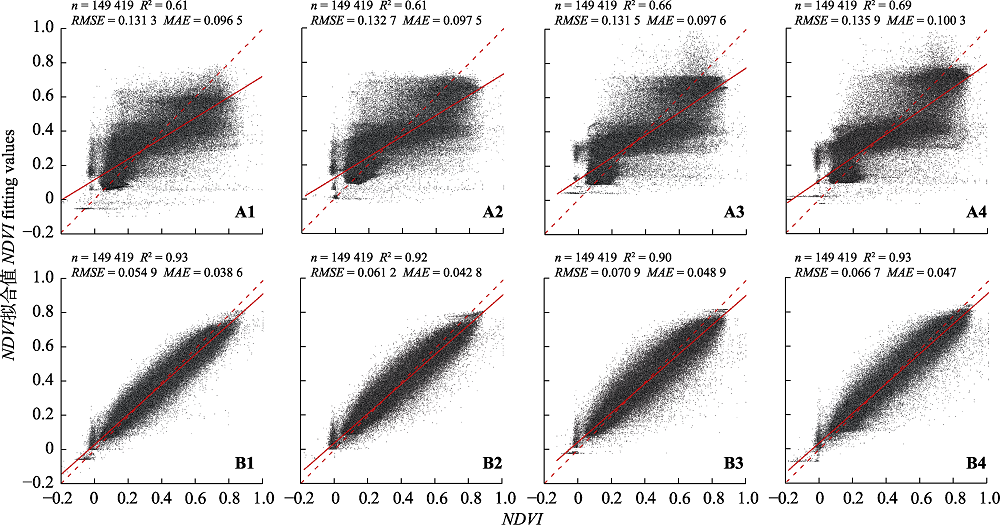
图6 多元线性回归模型(MLR)(A)和随机森林(RF)归一化植被指数(NDVI)拟合值(B)在2000 (1)、2005 (2)、2010 (3)和2015年(4)的验证散点图。MAE, 平均绝对误差; RMSE, 均方根误差。
Fig. 6 Scatter plot of normalized differential vegetation index (NDVI) fitting values of Multiple Linear Regression (MLR)(A) and Random Forest (RF)(B) in 2000 (1), 2005 (2), 2010 (3) and 2015 (4). MAE, mean absolute error; RMSE, root mean square error.
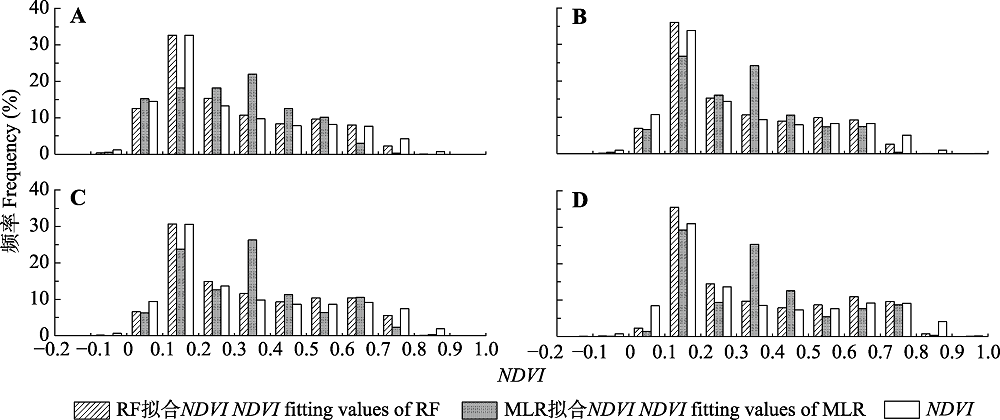
图7 2000 (A)、2005 (B)、2010 (C)和2015年(D)多元线性回归模型(MLR)和随机森林模型(RF)的归一化植被指数(NDVI)拟合值频率分布直方图。
Fig. 7 Frequency distribution histogram of normalized differential vegetation index (NDVI) fitting values of Multiple Linear Regression (MLR) and Random Forest (RF) in 2000 (A), 2005 (B), 2010 (C) and 2015 (D).
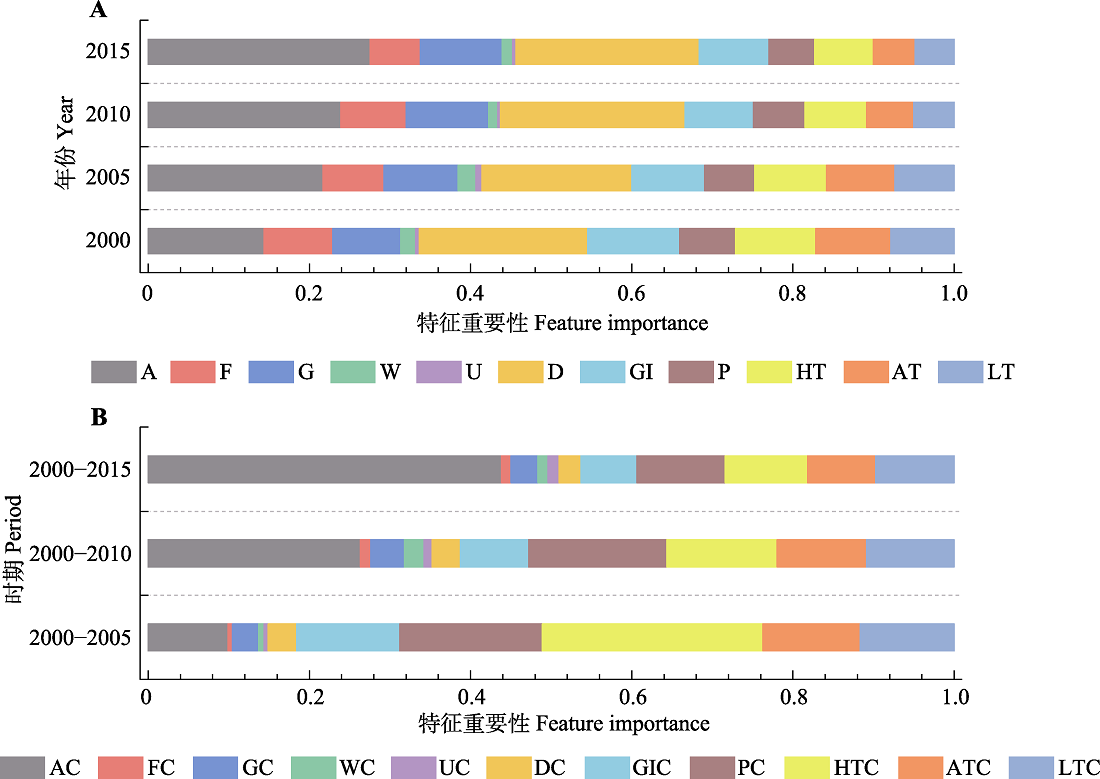
图8 归一化植被指数(NDVI)空间分布及变化的影响因子重要性。A, 每个字母代表各因子对静态NDVI的贡献。A, 耕地比例; AT, 年平均气温; D, 荒漠比例; F, 林地比例; G, 草地比例; GI, 放牧强度; HT, 年最高气温; LT, 年最低气温。P, 年累计降水量; U, 城市比例; W, 水体比例。B, 每个字母加后缀C代表各因子的变化对动态NDVI的贡献。
Fig. 8 Importance of impact factors of spatial distribution and change of normalized differential vegetation index (NDVI). A, Contribution of each factor to static NDVI. A, arable proportion; AT, annual average temperature; D, desert proportion; F, forest proportion; G, grassland proportion; GI, grazing intensity; HT, annual maximum temperature; LT, annual minimum temperature. P, annual cumulative precipitation; U, urban proportion; W, water body proportion. B, Add the suffix C to each letter to dynamic NDVI.
| 对静态NDVI的贡献率 Contribution to static NDVI | 对NDVI变化的贡献率 Contribution to dynamic NDVI | ||||||
|---|---|---|---|---|---|---|---|
| 2000 | 2005 | 2010 | 2015 | 2000-2005 | 2000-2010 | 2000-2015 | |
| 气候因子 Climate factor | 0.74 | 0.69 | 0.67 | 0.63 | 0.71 | 0.55 | 0.41 |
| 人类活动 Human activity | 0.26 | 0.31 | 0.33 | 0.37 | 0.29 | 0.35 | 0.59 |
表6 影响因子对归一化植被指数(NDVI)空间分布(静态)与变化(动态)的重要性统计
Table 6 Important statistics of the independent variables for spatial distribution (static) and change (dynamic) of normalized differential vegetation index (NDVI)
| 对静态NDVI的贡献率 Contribution to static NDVI | 对NDVI变化的贡献率 Contribution to dynamic NDVI | ||||||
|---|---|---|---|---|---|---|---|
| 2000 | 2005 | 2010 | 2015 | 2000-2005 | 2000-2010 | 2000-2015 | |
| 气候因子 Climate factor | 0.74 | 0.69 | 0.67 | 0.63 | 0.71 | 0.55 | 0.41 |
| 人类活动 Human activity | 0.26 | 0.31 | 0.33 | 0.37 | 0.29 | 0.35 | 0.59 |
| 分级标准 Rule (%) | NDVI | NDVI变化 NDVI change | ||||||
|---|---|---|---|---|---|---|---|---|
| 2000 | 2005 | 2010 | 2015 | 2000-2005 | 2000-2010 | 2000-2015 | ||
| 高估区 Overrated | <-5 | 16.70 | 17.72 | 15.28 | 13.54 | 1.71 | 2.85 | 3.78 |
| 准确区 Accurate | -5-5 | 65.73 | 64.30 | 68.69 | 71.68 | 96.28 | 93.76 | 92.01 |
| 低估区 Underrated | >5 | 17.57 | 17.98 | 16.03 | 14.78 | 2.00 | 3.39 | 4.21 |
表7 归一化植被指数(NDVI)拟合值区域差异
Table 7 Spatial difference of normalized differential vegetation index (NDVI) predicted value
| 分级标准 Rule (%) | NDVI | NDVI变化 NDVI change | ||||||
|---|---|---|---|---|---|---|---|---|
| 2000 | 2005 | 2010 | 2015 | 2000-2005 | 2000-2010 | 2000-2015 | ||
| 高估区 Overrated | <-5 | 16.70 | 17.72 | 15.28 | 13.54 | 1.71 | 2.85 | 3.78 |
| 准确区 Accurate | -5-5 | 65.73 | 64.30 | 68.69 | 71.68 | 96.28 | 93.76 | 92.01 |
| 低估区 Underrated | >5 | 17.57 | 17.98 | 16.03 | 14.78 | 2.00 | 3.39 | 4.21 |
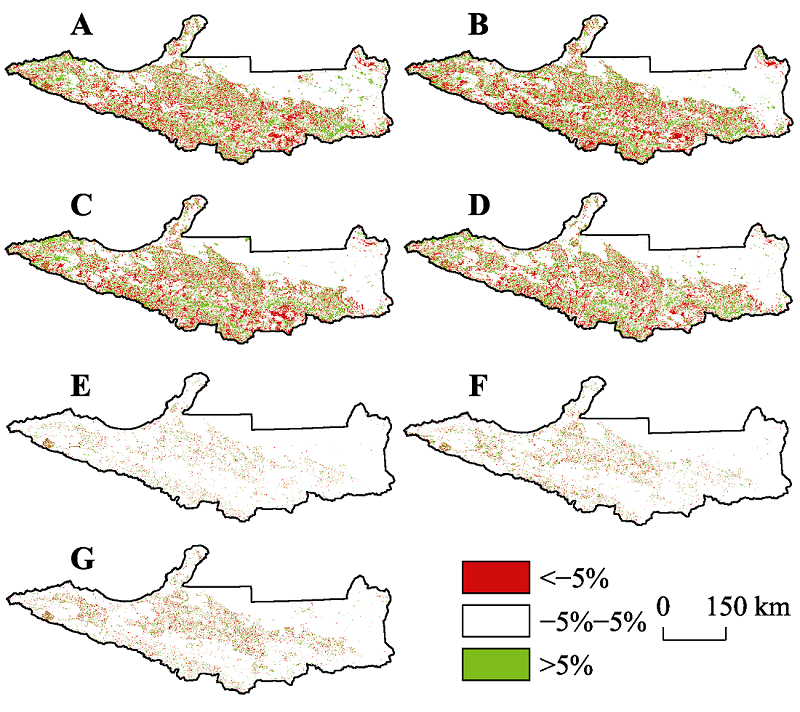
图9 2000 (A)、2005 (B)、2010 (C)、2015 (D)、2000-2005 (E)、2000-2010 (F)和2000-2015年(G)北天山北坡中段研究区归一化植被指数(NDVI)拟合值区域差异。
Fig. 9 Spatial difference of the normalized differential vegetation index (NDVI) predicted values in 2000 (A), 2005 (B), 2010 (C), 2015 (D), 2000-2005 (E), 2000-2010 (F), and 2000-2015 (G) in study area of the middle part of northern slope of the north Tianshan Mountains.
| [1] | Belgiu M, Drăguţ L (2016). Random Forest in Remote Sensing: a review of applications and future directions. ISPRS Journal of Photogrammetry and Remote Sensing, 114, 24-31. |
| [2] | Breiman L (2001). Random forests. Machine Learning, 45, 5-32. |
| [3] | Cai P, Hamdi R, Luo GP, He HL, Zhang M, Termonia P, de Maeyer P (2019). Agriculture intensification increases summer precipitation in Tianshan Mountains, China. Atmospheric Research, 227, 140-146. |
| [4] | Chen X, Luo GP, Xia J, Zhou KF, Lou SP, Ye MQ (2004). Ecological response of climate change on the northern slope of Tianshan Mountains in Xinjiang. Science in China Series D, 34, 1166-1175. |
| [ 陈曦, 罗格平, 夏军, 周可法, 娄少平, 叶民权 (2004). 新疆天山北坡气候变化的生态响应研究. 中国科学D辑, 34, 1166-1175.] | |
| [5] | Fang XR, Wen ZF, Chen JL, Wu SJ, Huang YY, Ma MH (2019). Remote sensing estimation of suspended sediment concentration based on Random Forest Regression Model. Journal of Remote Sensing, 23, 756-772. |
| [ 方馨蕊, 温兆飞, 陈吉龙, 吴胜军, 黄远洋, 马茂华 (2019). 随机森林回归模型的悬浮泥沙浓度遥感估算. 遥感学报, 23, 756-772.] | |
| [6] |
Gang C, Zhou W, Wang Z, Chen Y, Li J, Chen J, Qi J, Odeh I, Groisman PY (2015). Comparative assessment of grassland NPP dynamics in response to climate change in China, North America, Europe and Australia from 1981 to 2010. Journal of Agronomy and Crop Science, 201, 57-68.
DOI URL |
| [7] |
Gao JB, Jiao KW, Wu SH (2019). Revealing the climatic impacts on spatial heterogeneity of NDVI in China during 1982-2013. Acta Geographica Sinica, 74, 534-543.
DOI URL |
| [ 高江波, 焦珂伟, 吴绍洪 (2019). 1982-2013年中国植被NDVI空间异质性的气候影响分析. 地理学报, 74, 534-543.] | |
| [8] |
Gilbert M, Nicolas G, Cinardi G, van Boeckel TP, Vanwambeke SO, Wint GRW, Robinson TP (2018). Global distribution data for cattle, buffaloes, horses, sheep, goats, pigs, chickens and ducks in 2010. Scientific Data, 5, 180227. DOI: 10.1038/sdata.2018.227.
DOI URL PMID |
| [9] | Gu ZJ, Duan XW, Shi YD, Li Y, Pan X (2018). Spatiotemporal variation in vegetation coverage and its response to climatic factors in the Red River Basin, China. Ecological Indicators, 93, 54-64. |
| [10] | Han QF, Luo GP, Li CF, Shakir A, Wu M, Saidov A (2016). Simulated grazing effects on carbon emission in Central Asia. Agricultural and Forest Meteorology, 216, 203-214. |
| [11] | He K, Wu SX, Yang Y, Wang D, Zhang SY, Yin N (2018). Dynamic changes of land use and oasis in Xinjiang in the last 40 years. Arid Land Geography, 41, 1333-1340. |
| [ 贺可, 吴世新, 杨怡, 王丹, 张寿雨, 尹楠 (2018). 近40 a新疆土地利用及其绿洲动态变化. 干旱区地理, 41, 1333-1340.] | |
| [12] | Hu S, Wang FY, Zhan CS, Zhao RX, Mo XG, Liu LMZ (2019). Detecting and attributing vegetation changes in Taihang Mountain, China. Journal of Mountain Science, 16, 337-350. |
| [13] | Huang XT, Luo GP, He HL, Wang XX, Amuti T (2017). Ecological effects of grazing in the northern Tianshan Mountains. Water, 9, 932. DOI: 10.3390/w9120932. |
| [14] | Huang XT, Luo GP, Ye FP, Han QF (2018). Effects of grazing on net primary productivity, evapotranspiration and water use efficiency in the grasslands of Xinjiang, China. Journal of Arid Land, 10, 588-600. |
| [15] |
Kasza J, Wolfe R (2014). Interpretation of commonly used statistical regression models. Respirology, 19(1), 14-21.
URL PMID |
| [16] |
Krishnaswamy J, John R, Joseph S (2014). Consistent response of vegetation dynamics to recent climate change in tropical mountain regions. Global Change Biology, 20, 203-215.
URL PMID |
| [17] | Li JJ, Peng SZ, Li Z (2017). Detecting and attributing vegetation changes on China’s Loess Plateau. Agricultural and Forest Meteorology, 247, 260-270. |
| [18] | Liu Q, Yang ZP, Han F, Wang ZG, Wang CR (2016). NDVI-based vegetation dynamics and their response to recent climate change: a case study in the Tianshan Mountains, China. Environmental Earth Sciences, 75, 1189. DOI: 10.1007/s12665-016-5987-5. |
| [19] | Liu Y, Nie L, Yang Y (2018). Spatio-temporal evolution and climatic driving characteristics of grassland in Tianshan Mountain area in 2001-2015. Ecology and Environmental Sciences, 27, 802-810. |
| [ 刘艳, 聂磊, 杨耘 (2018). 2001-2015年天山地区草地NDVI时空演变和气候驱动特征分析. 生态环境学报, 27, 802-810.] | |
| [20] | Liu ZJ, Liu YS, Li YR (2018). Anthropogenic contributions dominate trends of vegetation cover change over the farming-pastoral ecotone of northern China. Ecological Indicators, 95, 370-378. |
| [21] | Lujan-Moreno GA, Howard PR, Rojas OG, Montgomery DC (2018). Design of experiments and response surface methodology to tune machine learning hyperparameters, with a random forest case-study. Expert Systems with Applications, 109, 195-205. |
| [22] | Ma QM, Jia XP, Wang HB, Li YS, Li SN (2019). Recent advances in driving mechanisms of climate and anthropogenic factors on vegetation change. Journal of Desert Research, 39(6), 48-55. |
| [ 马启民, 贾晓鹏, 王海兵, 李永山, 李劭宁 (2019). 气候和人为因素对植被变化影响的评价方法综述. 中国沙漠, 39(6), 48-55.] | |
| [23] |
Seddon AWR, Macias-Fauria M, Long PR, Benz D, Willis KJ (2016). Sensitivity of global terrestrial ecosystems to climate variability. Nature, 531, 229-232.
URL PMID |
| [24] | Sung S, Nicklas F, Georg K, Lee DK (2016). Estimating net primary productivity under climate change by application of Global Forest Model (G4M). Journal of the Korean Society People, Plants, and Environment, 19, 549-558. |
| [25] | Wang H, Zhou SL, Li XB, Liu HH, Chi DK, Xu KK (2016). The influence of climate change and human activities on ecosystem service value. Ecological Engineering, 87, 224-239. |
| [26] | Wang JB, Zhao J, Li CH, Zhu Y, Kang CY, Gao C (2019). The spatial-temporal patterns of the impact of human activities on vegetation coverage in China from 2001 to 2015. Acta Geographica Sinica, 74, 504-519. |
| [ 王建邦, 赵军, 李传华, 朱钰, 康重阳, 高超 (2019). 2001-2015年中国植被覆盖人为影响的时空格局. 地理学报, 74, 504-519.] | |
| [27] | Wang ZY, Xu DY, Yang H, Ding X, Li DJ (2017). Impacts of climate change and human activities on vegetation dynamics in Inner Mongolia, 1981-2010. Progress in Geography, 36, 1025-1032. |
| [ 王子玉, 许端阳, 杨华, 丁雪, 李达净 (2017). 1981-2010年气候变化和人类活动对内蒙古地区植被动态影响的定量研究. 地理科学进展, 36, 1025-1032.] | |
| [28] | Yang HF, Yao L, Wang YB, Li JL (2017). Relative contribution of climate change and human activities to vegetation degradation and restoration in north Xinjiang, China. The Rangeland Journal, 39, 289-302. |
| [29] | Zhang M, Luo GP, Cao XS, Hamdi R, Li T, Cai P, Ye H, He HL (2019). Numerical simulation of the irrigation effects on surface fluxes and local climate in typical mountain-oasis-desert systems in the central Asia arid area. Journal of Geophysical Research: Atmospheres, 124, 12485-12506. |
| [30] | Zhang Q, Yuan XL, Chen X, Luo GP, Li LH (2016). Vegetation change and its response to climate change in Central Asia from 1982 to 2012. Chinese Journal of Plant Ecology, 40, 13-23. |
| [ 张琪, 袁秀亮, 陈曦, 罗格平, 李龙辉 (2016). 1982-2012年中亚植被变化及其对气候变化的响应. 植物生态学报, 40, 13-23.] | |
| [31] | Zhang RP, Zhang YL, Guo J, Feng QS, Liang TG (2018). Comparison of spatial interpolation methods for precipitation distribution in Xinjiang region. Pratacultural Science, 35, 521-529. |
| [ 张仁平, 张云玲, 郭靖, 冯琦胜, 梁天刚 (2018). 新疆地区降水分布的空间插值方法比较. 草业科学, 35, 521-529.] | |
| [32] | Zheng K, Wei JZ, Pei JY, Cheng H, Zhang XL, Huang FQ, Li FM, Ye JS (2019). Impacts of climate change and human activities on grassland vegetation variation in the Chinese Loess Plateau. Science of the Total Environment, 660, 236-244. |
| [1] | 张琳, 袁伟影, 宋创业, 吴冬秀. 1998-2010年中国典型生态系统长期监测样地环境要素、物种丰富度和生物量动态数据集[J]. 植物生态学报, 2025, 49(8): 1182-1190. |
| [2] | 范亚冉, 夏少攀, 于冰冰, 朱紫琪, 杨威, 范豫川, 刘晓雨, 张旭辉, 郑聚锋. 大气CO2浓度升高和增温对土壤有机碳库积累、分子组成和结构稳定性的影响[J]. 植物生态学报, 2025, 49(7): 1053-1069. |
| [3] | 王堃莹, 邱贵福, 刘子赫, 孟君, 刘宇轩, 贾国栋. 气候变化对不同退化程度小叶杨林分生长和内在水分利用效率的调节[J]. 植物生态学报, 2025, 49(2): 343-355. |
| [4] | 黄美红, 牛梦秋, 杨鹏飞, 林洁, 廖周瑜, 陈建国, 向建英. 不同温度和埋藏深度对高山垫状植物山生福禄草种子出苗及幼苗生长的影响[J]. 植物生态学报, 2025, 49(12): 2092-2104. |
| [5] | 贺艺, 周静, 陈宸, 房庭舟, 苏剑, 高浩杰, 曹嘉浩, 杨飞宇, 范淇博, 朱乐瑶, 陈薏名, 杨飞, 王毅腾, 冯雷, 刘飞, 梁爽, 蒋明凯, 陈军, 赵云鹏, 陈伟乐, 赵颖, 黄建国. 浙江海岛濒危树种的保护与恢复[J]. 植物生态学报, 2025, 49(10): 1583-1599. |
| [6] | 张鹏, 焦亮, 薛儒鸿, 魏梦圆, 杜达石, 吴璇, 王旭鸽, 李倩. 干旱强度影响祁连山西段不同海拔青海云杉的生长恢复[J]. 植物生态学报, 2024, 48(8): 977-987. |
| [7] | 史倩, 同小娟, 许玲玲, 孟平, 于裴洋, 李俊, 杨铭鑫. 油松早晚材径向生长对气候因子的响应[J]. 植物生态学报, 2024, 48(8): 988-1000. |
| [8] | 陈以恒, 玉素甫江•如素力, 阿卜杜热合曼•吾斯曼. 2001-2020年天山新疆段草地植被覆盖度时空变化及驱动因素分析[J]. 植物生态学报, 2024, 48(5): 561-576. |
| [9] | 张计深, 史新杰, 刘宇诺, 吴阳, 彭守璋. 气候变化下中国潜在自然植被生态系统碳储量动态[J]. 植物生态学报, 2024, 48(4): 428-444. |
| [10] | 臧妙涵, 王传宽, 梁逸娴, 刘逸潇, 上官虹玉, 全先奎. 基于纬度移栽的落叶松叶、枝、根生态化学计量特征对气候变暖的响应[J]. 植物生态学报, 2024, 48(4): 469-482. |
| [11] | 梁逸娴, 王传宽, 臧妙涵, 上官虹玉, 刘逸潇, 全先奎. 落叶松径向生长和生物量分配对气候变暖的响应[J]. 植物生态学报, 2024, 48(4): 459-468. |
| [12] | 吴茹茹, 刘美珍, 谷仙, 常馨月, 郭立月, 蒋高明, 祁如意. 气候变化对巨柏适宜生境分布的潜在影响和预测[J]. 植物生态学报, 2024, 48(4): 445-458. |
| [13] | 张启, 程雪寒, 王树芝. 北京西山老龄树记载的森林干扰历史[J]. 植物生态学报, 2024, 48(3): 341-348. |
| [14] | 杨宇萌, 来全, 刘心怡. 气候变化和人类活动对内蒙古植被总初级生产力的定量影响[J]. 植物生态学报, 2024, 48(3): 306-316. |
| [15] | 兰光飞, 张强, 陈相标, 陈仕东, 熊德成, 刘小飞, 杨智杰, 杨玉盛. 中亚热带格氏栲林凋落物季节动态特征及其影响因素[J]. 植物生态学报, 2024, 48(12): 1589-1601. |
| 阅读次数 | ||||||
|
全文 |
|
|||||
|
摘要 |
|
|||||
Copyright © 2026 版权所有 《植物生态学报》编辑部
地址: 北京香山南辛村20号, 邮编: 100093
Tel.: 010-62836134, 62836138; Fax: 010-82599431; E-mail: apes@ibcas.ac.cn, cjpe@ibcas.ac.cn
备案号: 京ICP备16067583号-19
![]()