
植物生态学报 ›› 2010, Vol. 34 ›› Issue (1): 58-63.DOI: 10.3773/j.issn.1005-264x.2010.01.009 cstr: 32100.14.j.issn.1005-264x.2010.01.009
所属专题: 生态化学计量
吴统贵1,2,*, 陈步峰1,**( ), 肖以华1, 潘勇军1, 陈勇1, 萧江华2
收稿日期:2008-09-25
接受日期:2009-04-17
出版日期:2010-09-25
发布日期:2010-01-01
作者简介:** E-mail: zsjcsdwcb@126.com
WU Tong-Gui1,2,*, CHEN Bu-Feng1,**(), XIAO Yi-Hua1, PAN Yong-Jun1, CHEN Yong1, XIAO Jiang-Hua2
Received:2008-09-25
Accepted:2009-04-17
Online:2010-09-25
Published:2010-01-01
摘要:
以珠江三角洲3种典型森林类型(常绿阔叶林、针阔混交林和针叶林)为研究对象, 分析了各类型优势乔木叶片C、N、P化学计量特征。结果显示, 所有研究个体叶片C、N、P含量范围分别为434-537、6.8-23.0和0.56-2.10 mg·g-1, C:N、C:P和N:P的分布区间分别为 21.22-70.74、227.14-844.64和5.26-20.91, 且N与P之间、C:N与C:P之间具有较好的协同性。3种森林类型中, 针叶林乔木叶片C含量最大, 加权平均值为(517.85 ± 35.96) mg·g-1, 其次是针阔混交林((509.47 ± 19.38) mg·g-1), 常绿阔叶林最小((481.59 ± 18.35) mg·g-1); 针叶林乔木叶片N含量((12.20 ± 5.65) mg·g-1)最大, 其次是常绿阔叶林((11.50 ± 4.24) mg·g-1), 针阔混交林((10.51 ± 5.22) mg·g-1)最小; 各森林类型乔木叶片P含量大小顺序与C含量完全相反, 为常绿阔叶林((1.31 ± 0.48) mg·g-1)>针阔混交林((0.96 ± 0.61) mg·g-1)>针叶林((0.77 ± 0.40) mg·g-1)。针阔混交林乔木叶片C:N (51.35 ± 13.65)最大, 针叶林(47.40 ± 15.85)其次, 常绿阔叶林(45.59 ± 14.70)最小; 各森林类型乔木叶片C:P和N:P大小顺序相同, 均为针叶林(727.47 ± 231.52、15.71 ± 3.76)>针阔混交林(553.01 ± 152.32、10.93 ± 1.89)>常绿阔叶林(412.19 ± 200.91、9.46 ± 4.28)。同时根据乔木叶片N:P还发现, 少数阔叶树种和常绿阔叶林生产力受到N素限制。
吴统贵, 陈步峰, 肖以华, 潘勇军, 陈勇, 萧江华. 珠江三角洲3种典型森林类型乔木叶片生态化学计量学. 植物生态学报, 2010, 34(1): 58-63. DOI: 10.3773/j.issn.1005-264x.2010.01.009
WU Tong-Gui, CHEN Bu-Feng, XIAO Yi-Hua, PAN Yong-Jun, CHEN Yong, XIAO Jiang-Hua. Leaf stoichiometry of trees in three forest types in Pearl River Delta, South China. Chinese Journal of Plant Ecology, 2010, 34(1): 58-63. DOI: 10.3773/j.issn.1005-264x.2010.01.009
| 森林类型 Types | 物种 Species | C (mg·g-1) | N (mg·g-1) | P (mg·g-1) | C:N | C:P | N:P |
|---|---|---|---|---|---|---|---|
| 常绿阔叶林 Evergreen broad-leaved forest | 米老排 Mytilaria laosensis | 484 | 14.0 | 1.80 | 34.57 | 268.89 | 7.78 |
| 乐昌含笑 Michelia chapensis | 480 | 12.0 | 1.20 | 40.00 | 400.00 | 10.00 | |
| 红椎 Castanopsis hystrix | 487 | 9.6 | 0.86 | 50.73 | 566.28 | 11.16 | |
| 火力楠 Michelia macclurel | 481 | 6.8 | 0.98 | 70.74 | 490.82 | 6.94 | |
| 黧蒴锥 Castanopsis fissa | 488 | 10.0 | 1.90 | 48.80 | 256.84 | 5.26 | |
| 海南红豆 Ormosia pinnata | 494 | 21.0 | 1.50 | 23.52 | 329.33 | 14.00 | |
| 红胶木 Tristania conferta | 476 | 14.0 | 0.71 | 34.00 | 670.42 | 19.72 | |
| 尖叶杜英 Elaeocarpus apiculatus | 434 | 11.0 | 1.40 | 39.45 | 310.00 | 7.86 | |
| 荷木 Schima superb | 473 | 7.9 | 0.56 | 59.87 | 844.64 | 14.11 | |
| 枫香 Liquidambar formosana | 452 | 7.3 | 0.68 | 61.92 | 664.71 | 10.74 | |
| 群落加权平均值 Weighted average | 481.59 | 11.5 | 1.31 | 45.59 | 412.19 | 9.46 | |
| 标准差 SD | 18.35 | 4.24 | 0.48 | 14.70 | 200.91 | 4.28 | |
| 针阔混交林 Coniferous and broad-leaved mixed forest | 湿地松 Pinus elliottii | 520 | 9.0 | 0.87 | 57.78 | 597.7 | 10.34 |
| 红胶木 Tristania conferta | 485 | 13.0 | 1.00 | 37.31 | 485.00 | 13.00 | |
| 楝叶吴茱萸 Evodia glabrifolia | 474 | 19.0 | 2.00 | 24.95 | 237.00 | 9.50 | |
| 黧蒴锥 Castanopsis fissa | 475 | 13.0 | 0.98 | 36.54 | 484.69 | 13.27 | |
| 乐昌含笑 Michelia chapensis | 477 | 22.0 | 2.10 | 21.68 | 227.14 | 10.48 | |
| 群落加权平均值 Weighted average | 509.47 | 10.51 | 0.96 | 51.35 | 553.01 | 10.93 | |
| 标准差 SD | 19.38 | 5.22 | 0.61 | 13.65 | 152.32 | 1.89 | |
| 针叶林 Coniferous forest | 马尾松 Pinus massoniana | 537 | 9.6 | 0.64 | 55.94 | 839.06 | 15.00 |
| 黄牛木 Cratoxylum ligustrinum | 454 | 16.0 | 0.96 | 28.38 | 472.92 | 16.67 | |
| 银姬小蜡 Ligustrum sinense | 488 | 23.0 | 1.10 | 21.22 | 443.64 | 20.91 | |
| 潺槁木姜子 Litsea glutinosa | 470 | 19.0 | 1.60 | 24.74 | 293.75 | 11.88 | |
| 群落加权平均值 Weighted average | 517.85 | 12.20 | 0.77 | 47.40 | 727.47 | 15.71 | |
| 标准差 SD | 35.96 | 5.65 | 0.40 | 15.85 | 231.53 | 3.76 |
表1 乔木叶片中C、N、P生态化学计量指标
Table 1 C, N, P stoichiometry of tree leaf
| 森林类型 Types | 物种 Species | C (mg·g-1) | N (mg·g-1) | P (mg·g-1) | C:N | C:P | N:P |
|---|---|---|---|---|---|---|---|
| 常绿阔叶林 Evergreen broad-leaved forest | 米老排 Mytilaria laosensis | 484 | 14.0 | 1.80 | 34.57 | 268.89 | 7.78 |
| 乐昌含笑 Michelia chapensis | 480 | 12.0 | 1.20 | 40.00 | 400.00 | 10.00 | |
| 红椎 Castanopsis hystrix | 487 | 9.6 | 0.86 | 50.73 | 566.28 | 11.16 | |
| 火力楠 Michelia macclurel | 481 | 6.8 | 0.98 | 70.74 | 490.82 | 6.94 | |
| 黧蒴锥 Castanopsis fissa | 488 | 10.0 | 1.90 | 48.80 | 256.84 | 5.26 | |
| 海南红豆 Ormosia pinnata | 494 | 21.0 | 1.50 | 23.52 | 329.33 | 14.00 | |
| 红胶木 Tristania conferta | 476 | 14.0 | 0.71 | 34.00 | 670.42 | 19.72 | |
| 尖叶杜英 Elaeocarpus apiculatus | 434 | 11.0 | 1.40 | 39.45 | 310.00 | 7.86 | |
| 荷木 Schima superb | 473 | 7.9 | 0.56 | 59.87 | 844.64 | 14.11 | |
| 枫香 Liquidambar formosana | 452 | 7.3 | 0.68 | 61.92 | 664.71 | 10.74 | |
| 群落加权平均值 Weighted average | 481.59 | 11.5 | 1.31 | 45.59 | 412.19 | 9.46 | |
| 标准差 SD | 18.35 | 4.24 | 0.48 | 14.70 | 200.91 | 4.28 | |
| 针阔混交林 Coniferous and broad-leaved mixed forest | 湿地松 Pinus elliottii | 520 | 9.0 | 0.87 | 57.78 | 597.7 | 10.34 |
| 红胶木 Tristania conferta | 485 | 13.0 | 1.00 | 37.31 | 485.00 | 13.00 | |
| 楝叶吴茱萸 Evodia glabrifolia | 474 | 19.0 | 2.00 | 24.95 | 237.00 | 9.50 | |
| 黧蒴锥 Castanopsis fissa | 475 | 13.0 | 0.98 | 36.54 | 484.69 | 13.27 | |
| 乐昌含笑 Michelia chapensis | 477 | 22.0 | 2.10 | 21.68 | 227.14 | 10.48 | |
| 群落加权平均值 Weighted average | 509.47 | 10.51 | 0.96 | 51.35 | 553.01 | 10.93 | |
| 标准差 SD | 19.38 | 5.22 | 0.61 | 13.65 | 152.32 | 1.89 | |
| 针叶林 Coniferous forest | 马尾松 Pinus massoniana | 537 | 9.6 | 0.64 | 55.94 | 839.06 | 15.00 |
| 黄牛木 Cratoxylum ligustrinum | 454 | 16.0 | 0.96 | 28.38 | 472.92 | 16.67 | |
| 银姬小蜡 Ligustrum sinense | 488 | 23.0 | 1.10 | 21.22 | 443.64 | 20.91 | |
| 潺槁木姜子 Litsea glutinosa | 470 | 19.0 | 1.60 | 24.74 | 293.75 | 11.88 | |
| 群落加权平均值 Weighted average | 517.85 | 12.20 | 0.77 | 47.40 | 727.47 | 15.71 | |
| 标准差 SD | 35.96 | 5.65 | 0.40 | 15.85 | 231.53 | 3.76 |
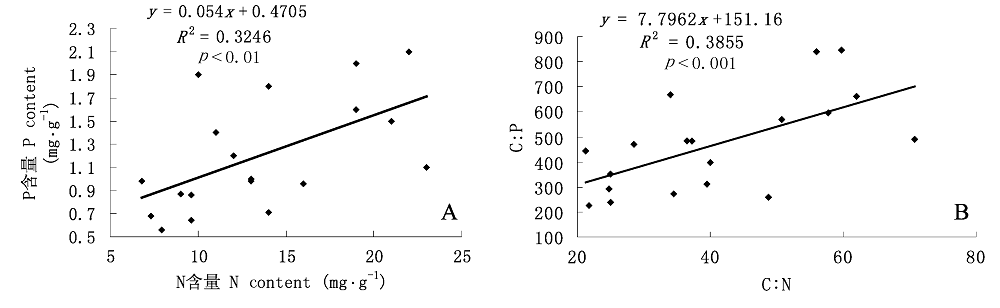
图1 叶片N、P含量间(A)以及C:N和C:P间(B)的关系。
Fig. 1 Relationships between N and P content (A), C:N and C:P (B) of leaves.
| [1] |
Aerts R (1996). Nutrient resorption from senescing leaves of perennials: Are there general patterns? Journal of Ecology, 84, 597-608.
DOI URL |
| [2] | Aerts R, Chapin FS III (2000). The mineral nutrition of wild plants revisited: a re-evaluation of processes and patterns. Advances in Ecological Research, 30, 1-68. |
| [3] |
Anderson T, Elser JJ, Hessen DO (2004). Stoichiometry and population dynamics. Ecology Letters, 7, 884-900.
DOI URL |
| [4] | Chen BF (陈步峰), Chen Y (陈勇), Yin GT (尹光天), Ye SS (叶骚胜), Ouyang W (欧阳文), Lin MX (林明献) (2004). Study on the water quality of urban forest ecosystem in the Pearl River Delta. Forest Research (林业科学研究), 17, 453-460. (in Chinese with English abstract) |
| [5] |
Elser JJ, Dobberfuhl D, Mackay NA, Schampel JH (1996). Organism size, life history, and N:P stoichiometry: towards a unified view of cellular and ecosystem processes. BioScience, 46, 674-684.
DOI URL |
| [6] |
Elser JJ, Stemer RW, Gorokhova E, Fagan WF, Markow TA, Cotner JB, Harrison JF, Hobbie SE, Odell GM, Weider LJ (2000). Biological stoichiometry from genes to ecosystems. Ecology Letters, 3, 540-550.
DOI URL |
| [7] | Fan HB (樊后保), Li YY (李燕燕), Zhang Y (张义), Sun X (孙新) (2004). Nutrient concentrations of vegetation and forest floor in pure Pinus massoniana stand and its mixed forest. Journal of Fujian College of Forestry (福建林学院学报), 24, 289-293. (in Chinese with English abstract) |
| [8] |
Güsewell S (2004). N:P ratios in terrestrial plants: variation and functional significance. New Phytologist, 164, 243-266.
DOI URL |
| [9] | Güsewell S, Koerselman W (2002). Variation in nitrogen and phosphorus concentrations of wetland plants. Perspective in Ecology, Evolution and Systematics, 5, 37-61. |
| [10] |
Güsewell S, Koerselman W, Verhoeven JTA (2002). Biomass N:P ratios as indicators of nutrient limitation for plant populations in wetlands. Ecological Applications, 13, 372-384.
DOI URL |
| [11] |
Han WX, Fang JY, Guo DL, Zhang Y, Reich PB (2005). Leaf nitrogen and phosphorus stochiometry across 753 terrestrial plant species in China. New Phytologist, 168, 377-385.
DOI URL |
| [12] |
He JS, Fang JY, Wang ZH, Guo DL, Flynn DFB, Geng Z (2006). Stoichiometry and large-scale patterns of leaf carbon and nitrogen in the grassland biomes of China. Oecologia, 149, 115-122.
DOI URL PMID |
| [13] |
He JS, Wang L, Flynn DFB, Wang XP, Ma WH, Fang JY (2008). Leaf nitrogen:phosphorus stoichiometry across Chinese grassland biomes. Oecologia, 155, 301-310.
DOI URL PMID |
| [14] |
Hedin LO (2004). Global organization of terrestrial plantnutrient interactions. Proceedings of the National Academy of Sciences of the United States of America, 101, 10849-10850.
DOI URL PMID |
| [15] | Huang JJ (黄建军), Wang XH (王希华) (2003). Leaf nutrient and structural characteristics of 32 evergreen broad-leaved species. Journal of East China Normal University (Natural Science Edition) 华东师范大学学报(自然科学版)), (1), 92-97. (in Chinese with English abstract) |
| [16] |
Koerselman W, Meuleman AFM (1996). The vegetation N:P ratio: a new tool to detect the nature of nutrient limitation. Journal of Applied Ecology, 33, 1441-1450.
DOI URL |
| [17] | Lerman A, Mackenzie FT, Ver LMB (2000). Nitrogen and phosphorous controls of the carbon cycle. Journal of Conference Abstracts, 5, 638. |
| [18] | Luo TS (骆土寿), Liu WQ (刘伟钦), Yin GT (尹光天), Luo RQ (罗瑞强), Li YD (李意德), Chen DX (陈德祥) (2004). Study on the soil environmental quality of forest rehabilitation in Shunde, Guangdong Province. Forest Research (林业科学研究), 17, 541-546. (in Chinese with English abstract) |
| [19] | Ma QY (马钦彦), Chen XL (陈遐林), Wang J (王娟), Lin C (蔺琛), Kang FF (康峰峰), Cao WQ (曹文强), Ma ZB (马志波), Li WY (李文宇) (2002). Carbon content rate in constructive species of main forest types in Northern China. Journal of Beijing Forestry University (北京林业大学学报), 24(5-6), 96-100. (in Chinese with English abstract) |
| [20] |
McGroddy ME, Daufresne T, Hedin LO (2004). Scaling of C:N:P stoichiometry in forests worldwide: implications of terrestrial Redfield-type ratios. Ecology, 85, 2390-2401.
DOI URL |
| [21] |
Reich PB, Oleksyn J (2004). Global patterns of plant leaf N and P in relation to temperature and latitude. Proceedings of the National Academy of Science of the United States of America, 101, 11001-11006.
DOI URL |
| [22] |
Reiners WA (1986). Complementary models for ecosystems. American Naturalist, 127, 59-73.
DOI URL |
| [23] | Ren SJ (任书杰), Yu GR (于贵瑞), Tao B (陶波), Wang SQ (王绍强) (2007). Leaf nitrogen and phosphorus stoichiometry across 654 terrestrial plant species in NSTEC. Environmental Science (环境科学), 28(12), 1-9. (in Chinese with English abstract) |
| [24] |
Urabe J, Kyle M, Makino W, Yoshida T, Andersen T, Elser JJ (2002). Reduced light increases herbivore production due to stoichiometric effects of light: nutrient balance. Ecology, 83, 619-627.
DOI URL |
| [25] |
Vitouseck PM (1982). Nutrient cycling and nutrient use efficiency. American Naturalist, 119, 553-572.
DOI URL |
| [26] |
Wardle DA, Walker LR, Bardgett RD (2004). Ecosystem properties and forest decline in contrasting long-term chronosequences. Science, 305, 509-513.
URL PMID |
| [27] |
Wassen MJ, Olde Ventterink HGM, de Swart EOAM (1995). Nutrient concentrations in mire vegetation as a measure of nutrient limitation in mire ecosystems. Journal of Vegetation Science, 6, 5-16.
DOI URL |
| [28] | Yan ER (阎恩荣), Wang XH (王希华), Zhou W (周武) (2008). N:P stoichiometry in secondary succession in evergreen broadleaved forest, Tiangtong, East China. Journal of Plant Ecology (Chinese Version) (植物生态学报), 32, 13-22. (in Chinese with English abstract) |
| [29] | Zeng DH (曾德慧), Chen GS (陈广生) (2005). Ecological stoichiometry: a science to explore the complexity of living systems. Acta Phytoecologica Sinica (植物生态学报), 29, 1007-1019. (in Chinese with English abstract) |
| [30] | Zhang LX, Bai YF, Han XG (2003). Application of N:P stoichiometry to ecology studies. Acta Botanica Sinica, 45, 1009-1018. |
| [31] | Zheng SX (郑淑霞), Shangguan ZP (上官周平) (2006) Spatial distribution of leaf nutrition composition in Loess Plateau. Progress in Natural Science (自然科学进展), 16, 965-973. (in Chinese) |
| [1] | 张静, 陈洁, 李艳朋, 盘李军, 许涵, 李意德, 何海生. 南亚热带针阔混交人工林植物生物量比较及其影响因子分析[J]. 植物生态学报, 2026, 50(2): 400-416. |
| [2] | 张健, 孙慕梵, 宋坤, 赖丽茗, 宋永昌. 基于生态外貌-植物区系分类系统的中国常绿阔叶林分类修订[J]. 植物生态学报, 2026, 50(1): 107-122. |
| [3] | 戴允泽, 姚良锦, 陈淼, 徐小牛. 氮磷添加对常绿阔叶林土壤团聚体稳定性及其碳氮含量的影响[J]. 植物生态学报, 2026, 50(1): 55-69. |
| [4] | 赵琨, 王云琦, 梁军, 周小舟, 冯印成, 祁子寒, 李俊杰, 崔芯蕊, 刘烜沃, 毛维. 不同时间尺度下缙云山针阔混交林能量通量特征及影响因子分析[J]. 植物生态学报, 2026, 50(1): 70-81. |
| [5] | 赵常明, 熊高明, 申国珍, 葛结林, 徐文婷, 徐凯, 武元帅, 谢宗强. 2010年神农架常绿落叶阔叶混交林和亚高山针叶林长期监测样地植物物种组成和群落特征数据集[J]. 植物生态学报, 2025, 49(8): 1215-1228. |
| [6] | 徐志雄, 杞金华, 杨国平, 鲁志云, 杨效东, 范泽鑫. 2005-2010年哀牢山中山湿性常绿阔叶林长期监测样地植物物种组成和群落特征数据集[J]. 植物生态学报, 2025, 49(8): 1191-1204. |
| [7] | 刘世忠, 张倩媚, 张德强, 刘菊秀, 褚国伟, 李跃林. 1999-2015年鼎湖山季风常绿阔叶林长期监测样地植物物种组成和群落特征数据集[J]. 植物生态学报, 2025, 49(8): 1205-1214. |
| [8] | 曹毅, 张松林, 王旭峰, 杨安昌, 任敏慧, 杨浩, 韩超. 兰州市南北两山植物群落数据集[J]. 植物生态学报, 2025, 49(6): 975-989. |
| [9] | 何斌, 韩鹏宾, 唐勤. 中国铁坚油杉林的群落类型及特征[J]. 植物生态学报, 2025, 49(6): 833-839. |
| [10] | 张文瑾, 佘维维, 秦树高, 乔艳桂, 张宇清. 氮和水分添加对黑沙蒿群落优势植物叶片氮磷化学计量特征的影响[J]. 植物生态学报, 2024, 48(5): 590-600. |
| [11] | 兰光飞, 张强, 陈相标, 陈仕东, 熊德成, 刘小飞, 杨智杰, 杨玉盛. 中亚热带格氏栲林凋落物季节动态特征及其影响因素[J]. 植物生态学报, 2024, 48(12): 1589-1601. |
| [12] | 郑亚纹, 樊海东, 刘立斌, 倪健. 基于高精度遥感影像和精细植被踏查的金华北山植被制图[J]. 植物生态学报, 2024, 48(11): 1471-1485. |
| [13] | 陈昭铨, 王明慧, 胡子涵, 郎学东, 何云琼, 刘万德. 云南普洱季风常绿阔叶林幼苗的群落构建机制[J]. 植物生态学报, 2024, 48(1): 68-79. |
| [14] | 韩路, 冯宇, 李沅楷, 王雨晴, 王海珍. 地下水埋深对灰胡杨叶片与土壤养分生态化学计量特征及其内稳态的影响[J]. 植物生态学报, 2024, 48(1): 92-102. |
| [15] | 张英, 张常洪, 汪其同, 朱晓敏, 尹华军. 氮沉降下西南山地针叶林根际和非根际土壤固碳贡献差异[J]. 植物生态学报, 2023, 47(9): 1234-1244. |
| 阅读次数 | ||||||
|
全文 |
|
|||||
|
摘要 |
|
|||||
Copyright © 2026 版权所有 《植物生态学报》编辑部
地址: 北京香山南辛村20号, 邮编: 100093
Tel.: 010-62836134, 62836138; Fax: 010-82599431; E-mail: apes@ibcas.ac.cn, cjpe@ibcas.ac.cn
备案号: 京ICP备16067583号-19
![]()