
植物生态学报 ›› 2011, Vol. 35 ›› Issue (2): 167-175.DOI: 10.3724/SP.J.1258.2011.00167
马骏1,2, 唐海萍1,2,*( )
)
收稿日期:2010-04-14
接受日期:2010-11-12
出版日期:2011-04-14
发布日期:2011-01-21
通讯作者:
唐海萍
作者简介:*E-mail: tanghp@bnu.edu.cn
MA Jun1,2, TANG Hai-Ping1,2,*()
Received:2010-04-14
Accepted:2010-11-12
Online:2011-04-14
Published:2011-01-21
Contact:
TANG Hai-Ping
摘要:
2009年8-10月, 采用动态气室法观测了内蒙古农牧交错区多伦县农田、弃耕和围封3种土地利用方式下, 土壤呼吸速率从6:00到18:00的变化规律, 分析了不同深度的土壤温度与土壤含水量对土壤呼吸速率的控制作用。结果表明, 空间尺度上, 不同土地利用方式的土壤呼吸速率由高到低依次为: 农田>弃耕>围封; 时间尺度上, 土壤呼吸速率在6:00-18:00的变化趋势为单峰曲线, 在12:00-15:00达到峰值, 随后降低, 在18:00基本恢复到6:00左右的呼吸水平, 同时, 土壤呼吸速率在9、10月显著降低。利用Van’t Hoff指数模型研究不同深度土壤温度对土壤呼吸速率的影响发现, 10-15 cm深度的土壤温度对土壤呼吸速率的影响最为显著, 其中, 土壤呼吸温度敏感性由高到低分别为: 农田>围封>弃耕。相反, 由于8-10月土壤含水量变化较小, 故土壤含水量与土壤呼吸速率间的相关性不显著, 土壤含水量不能解释该时段土壤呼吸速率的变化。
马骏, 唐海萍. 内蒙古农牧交错区不同土地利用方式下土壤呼吸速率及其温度敏感性变化. 植物生态学报, 2011, 35(2): 167-175. DOI: 10.3724/SP.J.1258.2011.00167
MA Jun, TANG Hai-Ping. Variations of soil respiration rate and its temperature sensitivity among different land use types in the agro-pastoral ecotone of Inner Mongolia. Chinese Journal of Plant Ecology, 2011, 35(2): 167-175. DOI: 10.3724/SP.J.1258.2011.00167
| 重要因子 Important factors | 农田样地 Cropland plot | 弃耕样地 Abandoned cultivated plot | 围封样地 Grazing enclosure plot |
|---|---|---|---|
| 地理位置 Geographical position | 42°02′19.9″ N 116°16′49.2″ E | 42°02′19.9″ N 116°16′53.2″ E | 42°02′23.4″ N 116°17′9.4″ E |
| 植被组成 Vegetation composition | 小麦 Triticum aestivum 荞麦 Fagopyrum tataricum | 冰草 Agropyron cristatum 冷蒿 Artemisia frigida | 克氏针茅 Stipa krylovii 冷蒿 Artemisia frigida |
| 土壤容重 Soil bulk density (g·cm-3) | 1.34 | 1.50 | 1.46 |
| 土壤有机质 Soil organic matter (%) | 1.63 | 2.83 | 2.31 |
| 土地利用历史 Land-use history | 1 year | 9 years | 10 years |
表1 样地描述
Table 1 Description of study sites
| 重要因子 Important factors | 农田样地 Cropland plot | 弃耕样地 Abandoned cultivated plot | 围封样地 Grazing enclosure plot |
|---|---|---|---|
| 地理位置 Geographical position | 42°02′19.9″ N 116°16′49.2″ E | 42°02′19.9″ N 116°16′53.2″ E | 42°02′23.4″ N 116°17′9.4″ E |
| 植被组成 Vegetation composition | 小麦 Triticum aestivum 荞麦 Fagopyrum tataricum | 冰草 Agropyron cristatum 冷蒿 Artemisia frigida | 克氏针茅 Stipa krylovii 冷蒿 Artemisia frigida |
| 土壤容重 Soil bulk density (g·cm-3) | 1.34 | 1.50 | 1.46 |
| 土壤有机质 Soil organic matter (%) | 1.63 | 2.83 | 2.31 |
| 土地利用历史 Land-use history | 1 year | 9 years | 10 years |
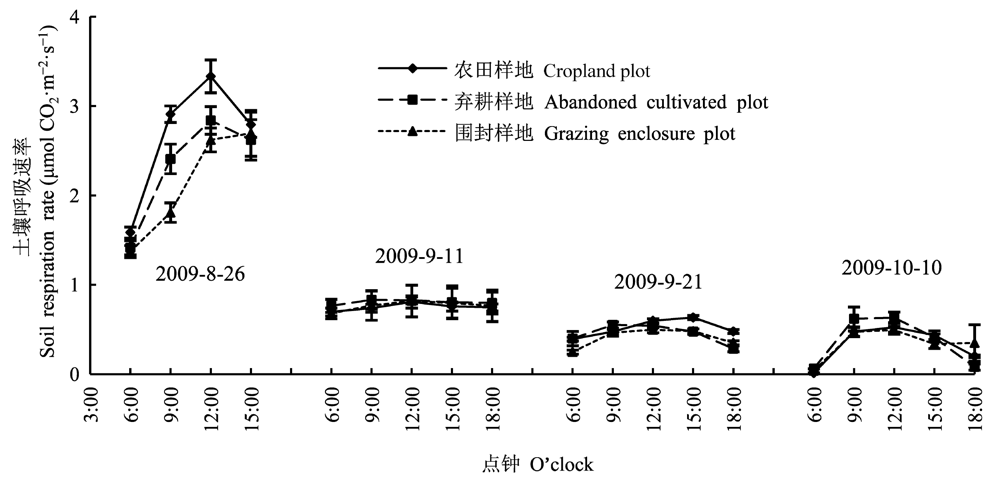
图1 农田、弃耕与围封样地土壤呼吸速率的变化(平均值±标准误差)。
Fig. 1 Variations of soil respiration rates in cropland, abandoned cultivated and grazing enclosure plots (mean ± SE).
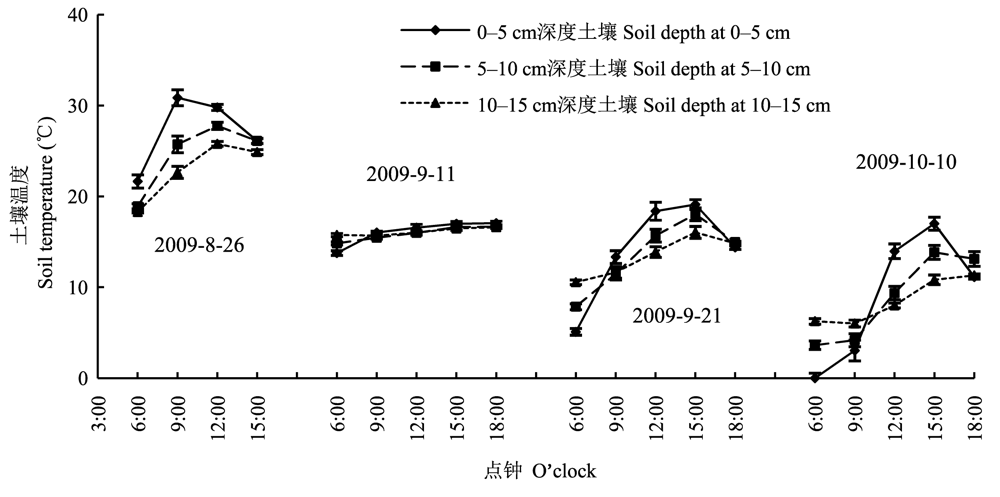
图2 不同深度的土壤温度(平均值±标准误差)。
Fig. 2 Soil temperatures at different soil depths (mean ± SE).
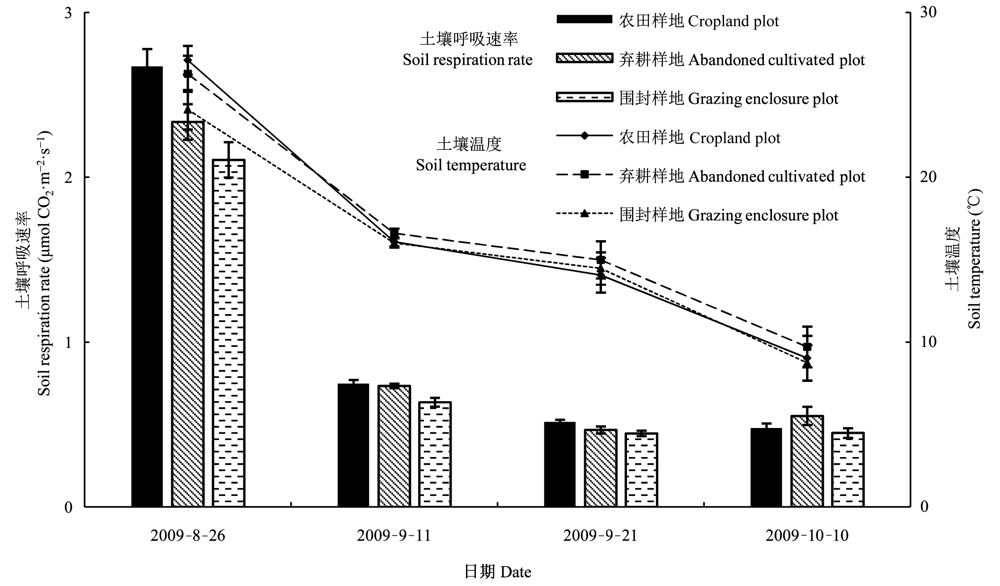
图3 农田、弃耕与围封样地土壤呼吸速率的比较(平均值±标准误差)。
Fig. 3 Comparisons of soil respiration rates among cropland, abandoned cultivated and grazing enclosure plots (mean ± SE).
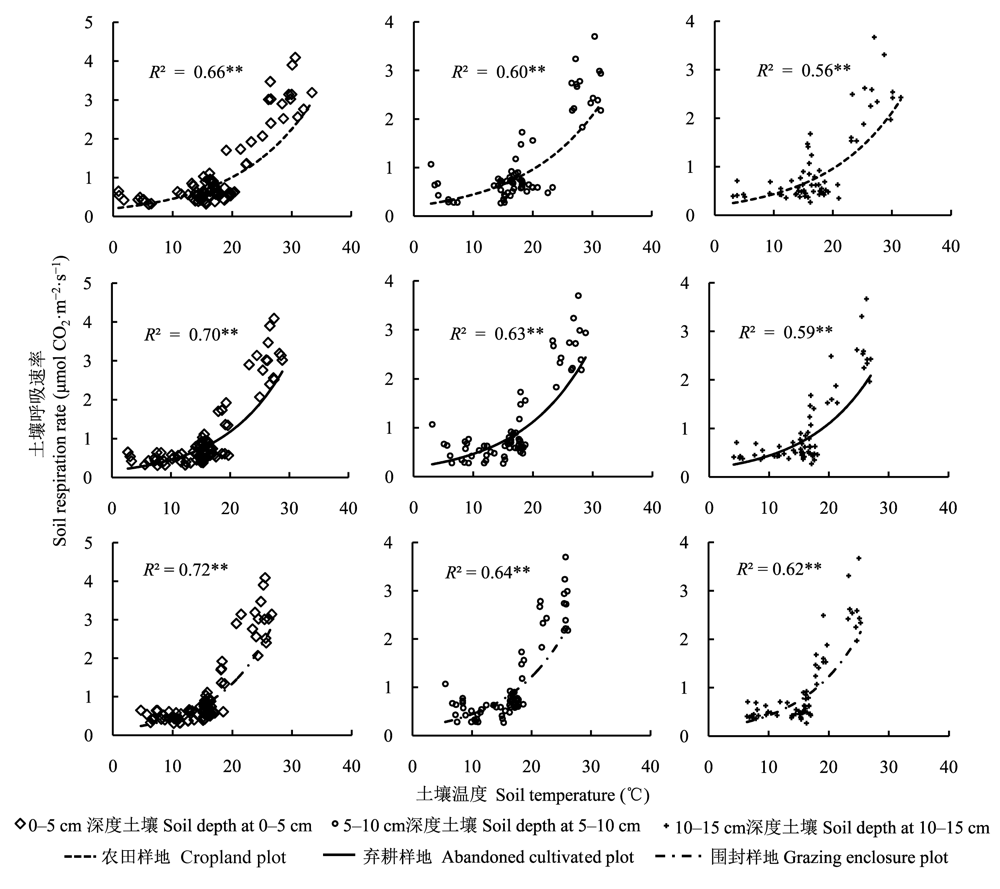
图4 不同深度土壤温度与土壤呼吸速率之间的关系。**, 相关性达到极显著水平(p < 0.01)。
Fig. 4 Relationships between soil respiration rate and soil temperature at different soil depths. **, correlation is significant at the 0.01 level.
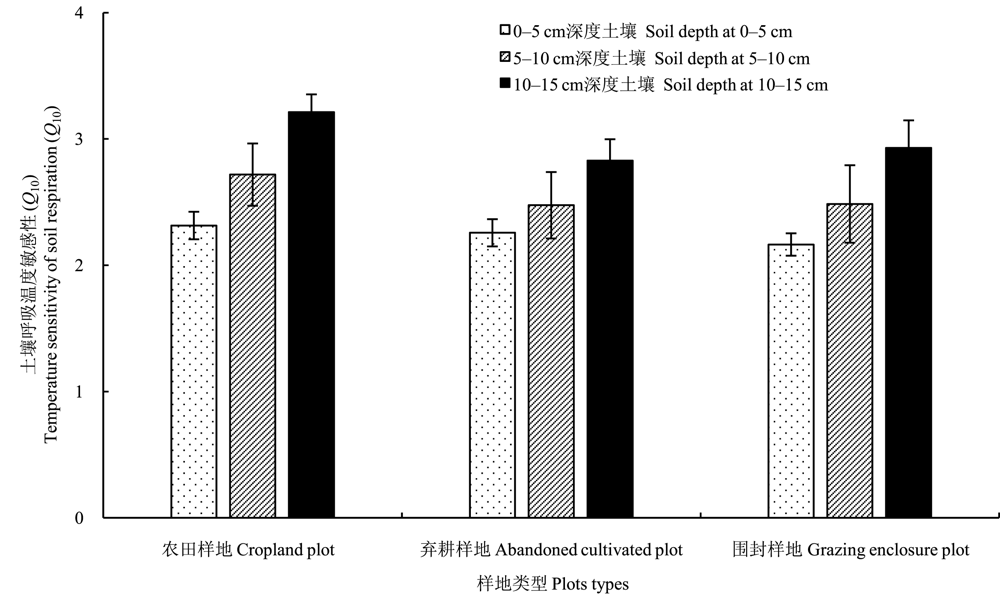
图5 农田、弃耕、围封样地中不同土壤深度的Q10值(平均值±标准误差)。
Fig. 5 Q10 at different soil depths at cropland, abandoned cultivated and grazing enclosure plots (mean ± SE).
| 土壤深度 Soil depth (cm) | 方程 Equation | R2 | p | |
|---|---|---|---|---|
| 农田样地 Cropland plot | 0-5 | y = 0.519 7e2.092 5x | 0.028 9 | p > 0.05 |
| 5-10 | y = 0.409 6e3.495 4x | 0.095 9 | p > 0.05 | |
| 10-15 | y = 0.446 6e3.049 2x | 0.104 5 | p > 0.05 | |
| 弃耕样地 Abandoned cultivated plot | 0-5 | y = 1.029 4e-15.000x | 0.505 8 | p > 0.05 |
| 5-10 | y = 0.401 0e7.800 8x | 0.051 8 | p > 0.05 | |
| 10-15 | y = 0.198 5e26.016x | 0.292 6 | p > 0.05 | |
| 围封样地 Grazing enclosure plot | 0-5 | y = 0.362 6e6.371 3x | 0.065 5 | p > 0.05 |
| 5-10 | y = 0.376 4e6.597 6x | 0.017 2 | p > 0.05 | |
| 10-15 | y = 0.298 7e12.059x | 0.143 3 | p > 0.05 |
表2 不同深度土壤含水量与土壤呼吸速率的关系
Table 2 Relationships between soil respiration rates and soil water content at different soil depths
| 土壤深度 Soil depth (cm) | 方程 Equation | R2 | p | |
|---|---|---|---|---|
| 农田样地 Cropland plot | 0-5 | y = 0.519 7e2.092 5x | 0.028 9 | p > 0.05 |
| 5-10 | y = 0.409 6e3.495 4x | 0.095 9 | p > 0.05 | |
| 10-15 | y = 0.446 6e3.049 2x | 0.104 5 | p > 0.05 | |
| 弃耕样地 Abandoned cultivated plot | 0-5 | y = 1.029 4e-15.000x | 0.505 8 | p > 0.05 |
| 5-10 | y = 0.401 0e7.800 8x | 0.051 8 | p > 0.05 | |
| 10-15 | y = 0.198 5e26.016x | 0.292 6 | p > 0.05 | |
| 围封样地 Grazing enclosure plot | 0-5 | y = 0.362 6e6.371 3x | 0.065 5 | p > 0.05 |
| 5-10 | y = 0.376 4e6.597 6x | 0.017 2 | p > 0.05 | |
| 10-15 | y = 0.298 7e12.059x | 0.143 3 | p > 0.05 |
| [1] |
Buyanovsky GA, Kucera CL, Wagner GH (1987). Comparative analysis of carbon dynamics in native and cultivated ecosystems. Ecology, 68, 2023-2031.
DOI URL PMID |
| [2] | Campos CA (2006). Response of soil surface CO2-C flux to land use changes in a tropical cloud forest (Mexico). Forest Ecology and Management, 234, 305-312. |
| [3] | Chen SQ (陈四清), Cui XY (崔骁勇), Zhou GS (周广胜), Li LH (李凌浩) (1999). Study on the CO2-release rate of soil respiration and litter decomposition in Stipa grandis steppe in Xilin River Basin, Inner Mongolia. Acta Botanica Sinica (植物学报), 41, 645-650. (in Chinese with English abstract) |
| [4] |
Cox PM, Betts RA, Jones CD, Spall SA, Totterdell IJ (2000). Acceleration of global warming due to carbon-cycle feedbacks in a coupled climate model. Nature, 408, 184-187.
DOI URL PMID |
| [5] | Cui XY (崔骁勇), Chen SQ (陈四清), Chen ZZ (陈佐忠) (2000). CO2 release from typical Stipa grandis grassland soil. Chinese Journal of Applied Ecology (应用生态学报), 11, 390-394. (in Chinese with English abstract) |
| [6] |
Dixon RK, Brown S, Houghton RA, Solomon AM, Trexler MC, Wisniewski J (1994). Carbon pools and flux of global forest ecosystems. Science, 263, 185-190.
DOI URL PMID |
| [7] | Feng CY (冯朝阳), Lü SH (吕世海), Gao JX (高吉喜), Liu SH (刘尚华), Lin D (林栋) (2008). Soil respiration characteristics of different vegetation types in the mountain areas of north China. Journal of Beijing Forestry University (北京林业大学学报), 30(2), 20-26. (in Chinese with English abstract) |
| [8] | Frank AB, Liebig MA, Tanaka DL (2006). Management effects on soil CO2 efflux in northern semiarid grassland and cropland. Soil and Tillage Research, 89, 78-85. |
| [9] |
Grünzweig JM, Sparrow SD, Chapin FS (2003). Impact of forest conversion to agriculture on carbon and nitrogen mineralization in subarctic Alaska. Biogeochemistry, 64, 271-296.
DOI URL |
| [10] |
Högberg P, Read DJ (2006). Towards a more plant physiological perspective on soil ecology. Trends in Ecology and Evolution, 21, 548-554.
DOI URL PMID |
| [11] |
Houghton RA, Hackler JL, Lawrence KT (1999). The U.S. carbon budget: contributions from land-use change. Science, 285, 574-578.
DOI URL PMID |
| [12] | Hu RG, Kusa K, Hatano R (2001). Soil respiration and methane flux in adjacent forest, grassland, and cornfield soils in Hokkaido, Japan. Soil Science and Plant Nutrition, 47, 621-627. |
| [13] |
Inubushi K, Furukawa Y, Hadi A, Purnomo E, Tsuruta H (2003). Seasonal changes of CO2, CH4 and N2O fluxes in relation to land-use changes in tropical peatlands located in coastal area of South Kalimantan. Chemosphere, 52, 603-608.
DOI URL PMID |
| [14] | Ishizuka S, Tsuruta H, Murdiyarso D (2002). An intensive field study on CO2, CH4, and N2O emissions from soils at four land use types in Sumatra, Indonesia. Global Biogeochemical Cycles, 16, 1049, doi: 10.1029/2001GB001614. |
| [15] | Jia BR (贾丙瑞), Zhou GS (周广胜), Wang FY (王风玉), Wang YH (王玉辉) (2004). A comparative study on soil respiration between grazing and fenced typical Leymus chinensis steppe, Inner Mongolia. Chinese Journal of Applied Ecology (应用生态学报), 15, 1611-1615. (in Chinese with English abstract) |
| [16] | Liu H, Zhao P, Lu P, Wang YS, Lin YB, Rao XQ (2008). Greenhouse gas fluxes from soils of different land-use types in a hilly area of South China. Agriculture, Ecosystems and Environment, 124, 125-135. |
| [17] | Lloyd J, Taylor JA (1994). On the temperature dependence of soil respiration. Functional Ecology, 8, 315-323. |
| [18] | Pavelka M, Acosta M, Marek MV, Kutsch W, Janous D (2007). Dependence of the Q10 values on the depth of the soil temperature measuring point. Plant and Soil, 292, 171-179. |
| [19] | Qi YC (齐玉春), Dong YS (董云社), Liu LX (刘立新), Liu XR (刘杏认), Peng Q (彭琴), Xiao SS (肖胜生), He YT (何亚婷) (2010). Spatial-temporal variation in soil respiration and its controlling factors in three steppes of Stipa L. in Inner Mongolia, China. Science China Earth Science (中国科学: 地球科学), 40, 341-351. (in Chinese) |
| [20] | Qi YC, Dong YS, Liu JY, Domroes M, Geng YB, Liu LX, Liu XR, Yang XH (2007). Effect of the conversion of grassland to spring wheat field on the CO2 emission characteristics in Inner Mongolia, China. Soil and Tillage Research, 94, 310-320. |
| [21] | Qi YC, Dong YS, Manfred D, Geng YB, Liu LX, Liu XR (2006). Comparison of CO2 effluxes and their driving factors between two temperate steppes in Inner Mongolia, China. Advances in Atmospheric Sciences, 23, 726-736. |
| [22] | Raich JW, Schlesinger WH (1992). The global carbon dioxide flux in soil respiration and its relationship to vegetation and climate. Tellus, 44B, 81-99. |
| [23] | Rayment MB, Jarvis PG (2000). Temporal and spatial variation of soil CO2 efflux in a Canadian boreal forest. Soil Biology and Biochemistry, 32, 35-45. |
| [24] | Reichstein M, Kätterer T, Andrén O, Ciais P, Schulze ED, Cramer W, Papale D, Valentini R (2005). Temperature sensitivity of decomposition in relation to soil organic matter pools: critique and outlook. Biogeosciences, 2, 317-321. |
| [25] | Rochette P, Ellert B, Gregorich EG, Desjardins RL, Pattey E, Lessard R, Johnson BG (1997). Description of a dynamic closed chamber for measuring soil respiration and its comparison with other techniques. Canadian Journal of Soil Science, 77, 195-203. |
| [26] | Rustad LE, Huntington TG, Boone RD (2000). Controls on soil respiration: implications for climate change. Biogeochemistry, 48, 1-6. |
| [27] | Sheng H, Yang YS, Yang ZJ, Chen GS, Xie JS, Guo JF, Zou SQ (2010). The dynamic response of soil respiration to land-use changes in subtropical China. Global Change Biology, 16, 1107-1121. |
| [28] | Shi GX (师广旭), Geng HL (耿浩林), Wang YL (王云龙), Wang YH (王玉辉), Qi XR (齐晓荣) (2008). Daily and seasonal dynamics of soil respiration and their environmental controlling factors in Stipa krylovii steppe. Acta Ecologica Sinica (生态学报), 28, 3408-3416. (in Chinese with English abstract) |
| [29] |
Tang J, Baldocchi DD, Xu L (2005). Tree photosynthesis modulates soil respiration on a diurnal time scale. Global Change Biology, 11, 1298-1304.
DOI URL PMID |
| [30] | Trumbore S (2006). Carbon respired by terrestrial ecosystems: recent progress and challenges. Global Change Biology, 12, 141-153. |
| [31] | Tufekcioglu A, Raich JW, Isenhart TM, Schultz RC (2001). Soil respiration within riparian buffers and adjacent crop fields. Plant and Soil, 229, 117-124. |
| [32] |
Wan SQ, Norby RJ, Ledford J, Weltzin J (2007). Responses of soil respiration to elevated CO2, air warming, and changing soil water availability in a model old-field grassland. Global Change Biology, 13, 2411-2424.
DOI URL |
| [33] | Wang GC (王庚辰), Du R (杜睿), Kong QX (孔琴心), Lü DR (吕达仁) (2004). Study on characteristics of soil respiration in temperate steppe in China. Chinese Science Bulletin (科学通报), 49, 692-696. (in Chinese) |
| [34] |
Wang W, Fang JY (2009). Soil respiration and human effects on global grasslands. Global and Planetary Change, 67, 20-28.
DOI URL |
| [35] | Wang W (王娓), Guo JX (郭继勋) (2002). Contribution of CO2 emission from soil respiration and from litter decomposition in Leymus chinensis community in Northeast Songnen Grassland. Acta Ecologica Sinica (生态学报), 22, 655-660. (in Chinese with English abstract) |
| [36] | Wang X (王旭), Zhou GS (周广胜), Jiang YL (蒋延玲), Li F (李峰) (2006). Comparison of soil respiration in broad- leaved Korean pine forest and reclaimed cropland in Changbai Mountains, China. Journal of Plant Ecology (Chinese Version) (植物生态学报), 30, 887-893. (in Chinese with English abstract) |
| [37] | Wu JG (吴建国), Zhang XQ (张小全), Xu DY (徐德应) (2003). The temporal variations of soil respiration under different land use in Liupan Mountain forest zone. Environmental Science (环境科学), 24(6), 23-32. (in Chinese with English abstract) |
| [38] | Wu Q (吴琴), Cao GM (曹广民), Hu QW (胡启武), Li D (李东), Wang YS (王跃思), Li YM (李月梅) (2005). A primary study on CO2 emission from soil-plant systems of Kobresia humilis meadow. Resources Science (资源科学), 27(2), 96-102. (in Chinese with English abstract) |
| [39] |
Xia JY, Han Y, Zhang Z, Zhang ZJ, Wan SQ (2009). Effects of diurnal warming on soil respiration are not equal to the summed effects of day and night warming in a temperate steppe. Biogeosciences, 6, 1361-1370.
DOI URL |
| [40] | Xu M, Qi Y (2001). Soil-surface CO2 efflux and its spatial and temporal variations in a young ponderosa pine plantation in northern California. Global Change Biology, 7, 667-677. |
| [41] | Xu WH, Wan SQ (2008). Water- and plant-mediated responses of soil respiration to topography, fire, and nitrogen fertilization in a semiarid grassland in northern China. Soil Biology and Biochemistry, 40, 679-687. |
| [42] | Yuste JC, Janssens IA, Carrara A, Ceulemans R (2004). Annual Q10 of soil respiration reflects plant phonological patterns as well as temperature sensitivity. Global Change Biology, 10, 161-169. |
| [43] | Zhang JB (张金波), Song CC (宋长春), Yang WY (杨文燕) (2005). Temperature sensitivity of soil respiration and its effecting factors in the different land use. Acta Scientiae Circumstantiae (环境科学学报), 25, 1537-1542. (in Chinese with English abstract) |
| [1] | 王袼, 胡姝娅, 李阳, 陈晓鹏, 李红玉, 董宽虎, 何念鹏, 王常慧. 不同类型草原土壤净氮矿化速率的温度敏感性[J]. 植物生态学报, 2024, 48(4): 523-533. |
| [2] | 沈健, 何宗明, 董强, 郜士垒, 林宇. 轻度火烧对滨海沙地人工林土壤呼吸速率和非生物因子的影响[J]. 植物生态学报, 2023, 47(7): 1032-1042. |
| [3] | 李雪, 董杰, 韩广轩, 张奇奇, 谢宝华, 李培广, 赵明亮, 陈克龙, 宋维民. 黄河三角洲典型滨海盐沼湿地土壤CO2和CH4排放对水盐变化的响应[J]. 植物生态学报, 2023, 47(3): 434-446. |
| [4] | 李建军, 刘恋, 陈迪马, 许丰伟, 程军回, 白永飞. 底座入土深度和面积对典型草原土壤呼吸测定结果的影响[J]. 植物生态学报, 2019, 43(2): 152-164. |
| [5] | 王祥, 朱亚琼, 郑伟, 关正翾, 盛建东. 昭苏山地草甸4种典型土地利用方式下的土壤呼吸特征[J]. 植物生态学报, 2018, 42(3): 382-396. |
| [6] | 柴曦, 李英年, 段呈, 张涛, 宗宁, 石培礼, 何永涛, 张宪洲. 青藏高原高寒灌丛草甸和草原化草甸CO2通量动态及其限制因子[J]. 植物生态学报, 2018, 42(1): 6-19. |
| [7] | 朱志成, 黄银, 许丰伟, 邢稳, 郑淑霞, 白永飞. 降雨强度和时间频次对内蒙古典型草原土壤氮矿化的影响[J]. 植物生态学报, 2017, 41(9): 938-952. |
| [8] | 葛晓改, 周本智, 肖文发, 王小明, 曹永慧, 叶明. 生物质炭添加对毛竹林土壤呼吸动态和温度敏感性的影响[J]. 植物生态学报, 2017, 41(11): 1177-1189. |
| [9] | 张蔷, 李家湘, 谢宗强. 氮添加对亚热带山地杜鹃灌丛土壤呼吸的影响[J]. 植物生态学报, 2017, 41(1): 95-104. |
| [10] | 姚辉, 胡雪洋, 朱江玲, 朱剑霄, 吉成均, 方精云. 北京东灵山3种温带森林土壤呼吸及其20年的变化[J]. 植物生态学报, 2015, 39(9): 849-856. |
| [11] | 许洺山, 黄海侠, 史青茹, 杨晓东, 周刘丽, 赵延涛, 张晴晴, 阎恩荣. 浙东常绿阔叶林植物功能性状对土壤含水量变化的响应[J]. 植物生态学报, 2015, 39(9): 857-866. |
| [12] | 王铭, 刘兴土, 张继涛, 李秀军, 王国栋, 鲁新蕊, 李晓宇. 松嫩平原西部草甸草原5种典型植物群落土壤呼吸的时空动态[J]. 植物生态学报, 2014, 38(4): 396-404. |
| [13] | 李悦, 刘颖慧, 申卫军, 徐霞, 田玉强. 内蒙古克氏针茅草原土壤异养呼吸对土壤温度和水分变化的响应[J]. 植物生态学报, 2014, 38(3): 238-248. |
| [14] | 吴君君, 杨智杰, 刘小飞, 熊德成, 林伟盛, 陈朝琪, 王小红. 米槠和杉木人工林土壤呼吸及其组分分析[J]. 植物生态学报, 2014, 38(1): 45-53. |
| [15] | 徐丽,于书霞,何念鹏,温学发,石培礼,张扬建,代景忠,王若梦. 青藏高原高寒草地土壤碳矿化及其温度敏感性[J]. 植物生态学报, 2013, 37(11): 988-997. |
| 阅读次数 | ||||||
|
全文 |
|
|||||
|
摘要 |
|
|||||
Copyright © 2026 版权所有 《植物生态学报》编辑部
地址: 北京香山南辛村20号, 邮编: 100093
Tel.: 010-62836134, 62836138; Fax: 010-82599431; E-mail: apes@ibcas.ac.cn, cjpe@ibcas.ac.cn
备案号: 京ICP备16067583号-19
![]()