Ecological remote sensing and application
Aims As the core area of the ecological security barrier in northwest China, Xinjiang has been highly concerned for the spatial variations in its ecological environment status and quality and their driving mechanisms.
Methods Based on the MODIS surface albedo data set (MOD09 A1) from 2003 to 2020, this study uses the advanced three-band gradient difference vegetation index (advanced TGDVI) to obtain the fractional vegetation cover (FVC), and uses multiple statistical methods, such as linear regression, partial correlation analysis, Tukey-test to analyze the spatio-temporal variation of FVC and to quantify the contribution of temperature, precipitation, and groundwater storage (GWS) to FVC in Xinjiang.
Important findings (1) In the past 18 years, the average FVC of Xinjiang has increased from 20.08% to 21.76%, showing an increasing trend as a whole, with a growth rate of 0.19%∙a-1, and a rapid growth stage is found after 2008. Among them, cropland has the largest growth rate (0.66%∙a-1), and sparse grassland has the slowest growth rate (0.11%∙a-1). (2) Temperature is an important factor affecting FVC in the whole growing season in Xinjiang. The influence of temperature on FVC is mainly concentrated in spring and autumn, while precipitation and GWS are the main factors in summer. (3) In summer, GWS is the main factor affecting FVC of shrubland and cropland, precipitation has the greatest impact on FVC of grassland, and GWS has a greater impact on FVC of sparse grassland in summer. (4) With the hydrothermal conditions becoming wetter, the influence of temperature on FVC in Xinjiang gradually decreases, while the influence of precipitation increases. The influence of GWS on FVC increased from arid to semi-arid condition, and then it decreased from semi-arid to humid condition. The results of this study could provide theoretical foundation for ecological restoration and construction in Xinjiang, and have great significance for promoting the construction of ecological civilization and green sustainable development in Xinjiang.
Aims Along with intensified climatic warming and human activities, global arid areas have expanded in an unprecedented rate during the past decades. Dryland ecosystems have witnessed increased vulnerability and sensitivity to climate change. Exploring the time lag effect of climate change on dryland vegetation growth is becoming an important research highlight in current global change related studies.
Methods In this study, we synthesized the normalized difference vegetation index (NDVI) from Moderate- resolution Imaging Spectroradiometer (MODIS), the monthly gridded CRU TS4.05 (Climatic Research Unit Time-Series version 4.05) climate and drought information developed by the University of East Anglia, solar radiation information from ERA5 (ECMWF’s Fifth Generation Atmospheric Reanalysis of the Global Climate) and soil moisture information from the European Space Agency (ESA) Climate Change Initiative program (CCI). These data were designed to investigate the effects of climatic factors and their time-lag on grassland NDVI in Asian grasslands from 2001 to 2020. This analysis was conducted based on the window cross-correlation and one-dimensional linear regression.
Important findings Our study revealed that: 1) The grassland NDVI responded strongly to average temperature and total precipitation when there was no lag, but expressed a lag response to solar radiation and soil moisture (1-month). 2) The spatial distributions of the lag response of grassland NDVI to climate change were nonuniform, with significant differences observed between the western and eastern Asian grasslands. 3) We did not detect any apparent time-lag effects on interactions between grassland NDVI and self-calibrating Palmer Drought Index. 4) We argue that altitude could partly modulate the response of grassland NDVI to climatic variables in the grassland of Asian drylands.
Forests are crucial terrestrial ecosystems with wide distribution and substantial biomass, playing a vital role in the global carbon cycle. The estimation of aboveground biomass (AGB) in forests serves as a significant indicator of ecosystem productivity and is pivotal for studying material cycles and global climate change. Traditional methods for AGB estimation rely on individual tree-scale or forest stand-scale tree physical structural information measurements, which are often time-consuming and labor-intensive to obtain. Remote sensing technology offers a solution for comprehensively and multi-temporally obtaining forest structural information in large scale, making it indispensable for forest AGB estimation. Therefore, it is important to review and summarize recent advancements in remote sensing techniques for estimating forest AGB to promote their application and guide the development of related industries. This paper presents a comprehensive overview of the principles and methods used for estimating forest AGB using optical data, synthetic aperture radar (SAR) data, and light detection and ranging (LiDAR) data. It also analyzes the current status of synergistic estimation of forest AGB using multiple remote sensing data sources. The study highlights three key findings: (1) The use of novel remote sensing data, such as high-resolution satellite imagery and Global Ecosystem Dynamics Investigation LiDAR data, is expanding the boundaries of spatial and temporal resolutions, providing enhanced data sources for forest AGB research. (2) Synergistic approaches that combine multiple remote sensing data sources show promise in improving the accuracy of forest AGB estimation, but further optimization of related models is needed. (3) Machine learning, artificial intelligence, and deep learning techniques have been widely applied in forest AGB estimation, but continuous research on remote sensing mechanisms remains essential for innovation. Improvements in models and methodologies should revolve around a better understanding of these mechanisms.
Aims Ecosystem services such as carbon sequestration and climate regulation of wetland ecosystems are very important. Accurately assessing the carbon storage of natural reserves in the Yellow River Basin is helpful for carbon neutrality research and regional ecological protection and high-quality development.
Methods Based on field sampling and laboratory analysis, combined with remote sensing data, this study assessed carbon storage in the aboveground plant biomass and the top 50 cm soils of typical natural vegetation in Shaanxi Yellow River Wetland Provincial Nature Reserve. The total target area for assessment is 13 086.52 hm2, accounting for 23.87% of the nature reserve.
Important findings The results showed that the aboveground carbon storage of the tall-grass vegetation was significantly higher than that of the short-grass vegetation and shrubland, and their carbon densities were 496.73, 23.45 and 138.38 g·m-2, respectively; the carbon density of the soil at 0-50 cm was 7.15-11.98 kg·m-2, and the soil carbon storage in the tall-grass vegetation area (5.02 × 10⁵ t) was significantly higher than that of the beach without vegetation (2.09 × 10⁵ t), the short-grass vegetation area (3.40 × 10⁵ t) and short-shrubland area (1.45 × 10⁵ t); finally, combining the aboveground carbon storage in plant biomass and the soil carbon storage in the top 50 cm, the total carbon storage is estimated around 1.22 × 10⁶ t for the natural vegetation area of Shaanxi Yellow River Wetland Provincial Nature Reserve, of which proportions of carbon storage were 17.13%, 27.95%, 12.13% and 42.79% for beaches, short-grass vegetation area, short-shrubland, and tall-grass vegetation area. These results can provide basic data for the protection and restoration of natural wetlands and the improvement of carbon sink function in the middle reaches of the Yellow River.
Aims The southwestern China is a region with complex topography and diverse ecosystem and vegetation types. However, its role as an ecological barrier is being weakened by the effects of climate change and increasing pressure of human activities. This study examines the temporal dynamics of vegetation carbon use efficiency (CUE) in this region using the CMIP6 models, aiming to effectively reducing the uncertainties in prognostic results of future predictions. Methods We used MODIS remote sensing data for the period 2001-2014 and simulations from 15 models in the Phase 6 of the Coupled Model Intercomparison Project (CMIP6), to determine the capability of the new generation models in simulating the seasonal and annual vegetation CUE in the southwestern China. The performance of the models was ranked based on the composite rating index (MR). Important findings Most of the models used in this study underestimated the annual vegetation CUE, and their ability to simulate the spatial patterns in the trends of vegetation CUE is generally poor. However, some models performed relatively well in simulating the spatial distribution of multi-year average vegetation CUE; the top 1/3 tier included BCC-CSM2-MR, CMCC-ESM2, TaiESM, EC-Earth3-Veg and CAS-ESM2-0 in the order of performance. Among the seasons, the models best simulated the spatial distribution of vegetation CUE in summer, with better results from BCC-CSM2-MR, EC-Earth3-Veg, TaiESM, CMCC-ESM2 and CAS-ESM2-0. The simulation capability of the models for winter is second only to that for summer, and relatively poor for spring and autumn. Compared to the simulations by individual models, the multi-model ensemble mean (MME-S) reduced the uncertainties and exhibited a strong simulation capability, especially in the spatial distribution of vegetation CUE in local areas such as the Sichuan Basin. There was a lack of good simulation capability for the spatial distribution of vegetation CUE in Qingzang Plateau, Hengduan Mountains and other topographically complex areas. In general, before applying the CMIP6 models for regional vegetation CUE simulation, it is necessary to comprehensively evaluate the specific models from multiple perspectives to select the models with better simulation performance.
Aims Horqin Sandy Land is an important, but highly degraded, agro-pastoral region in the northern China region of Nei Mongol. There have been significant changes in vegetation condition over the past two decades, in response to changes in climate as well as restoration policies. In this study, we characterize the spatial and temporal changes in vegetation in the region over the past twenty years, in order to understand the complex mechanism of vegetation change, and provide a scientific basis for comprehensive management and rational implementation of ecological engineering in the future.
Methods We assessed the correlation between a time series of Normalized Difference Vegetation Index (NDVI) (derived from MODIS) from 2001 to 2020 with 10 key driving factors (including mean annual temperature, mean annual precipitation, slope, soil type, vegetation type, geomorphic type, population density, accumulated afforestation area, livestock density, and crops area) in space on random sampling points, which were generated in ArcGIS software. Geodetector model was used to explore the individual relationships as well as their interactions.
Important findings The results demonstrated that: (1) over the past 20 years, the vegetation coverage of Horqin Sandy Land has been gradually recovering, primarily in the northern, central and southeastern marginal areas of the study area, recovery area accounted for more than 64.91%. (2) Changes in NDVI were primarily explained in Horqin Sandy Land by variation in three factors, soil type, geomorphic type, and mean annual temperature. (3) The interactions between explanatory factors were nonlinearly and mutually enhanced, of these, there was a strong interaction between soil type and other factors. (4) Increases in vegetation cover in Horqin Sandy Land was primarily observed in association with alfisol, hills or small undulating mountains, and annual average temperature ranges 4.68-5.67 °C and so on. Future restoration programs may want to prioritize sites with these conditions.
Aims This study aims to explore a high-precision interpolation method of evapotranspiration based on machine learning to construct high-quality data set of actual evapotranspiration.
Methods Taking the typical alpine marsh wetland on the Qingzang Plateau as the observation station to study evapotranspiration, combined with meteorological factors (net radiation, air temperature, soil heat flux, wind speed, relative humidity, soil volumetric water content), we established a prediction model to construct an actual evapotranspiration data set with a high-precision interpolation method based on combining five methods including multiple linear regression (MLR), decision tree (CART), random forest (RF), support vector regression (SVR) and multi-layer perceptron (MLP).
Important findings 1) The correlation between evapotranspiration and net radiation was the largest in the study area, and soil heat flux was the key factor affecting the evapotranspiration process. 2) The determination coefficients are from 0.58 to 0.83 among five machine learning algorithm models with seven combinations, and the root mean square error ranges from 0.038 to 0.089 mm·30 min-1. 3) The random forest regression model has the highest determination coefficient, the best model stability and the best interpolation. 4) Interpolated evapotranspiration data had the same diurnal variation trend with net radiation, soil heat flux and ari temperature, but the opposite diurnal variation trend with wind speed and relative humidity. Daily evapotranspiration is mainly concentrated in the growing season, with the daily maximum (8.77 mm) on July 9 and the daily minimum (0.21 mm) on January 30.
Aims This study investigated the spatial and temporal variation of spring and autumn photosynthetic phenology of vegetation in the Dongting Lake basin and revealed its response to climate change, and provides a useful reference for the establishment of model of subtropical vegetation phenology and the evaluation of carbon budget.
Methods Using solar-induced chlorophyll fluorescence (SIF) data, we extracted spring photosynthetic phenology (the start date of photosynthesis) and autumn photosynthetic phenology (the end date of photosynthesis) of vegetation in Dongting Lake basin, and evaluated temporal and spatial patterns of vegetation spring and autumn photosynthetic phenology and its response to climate change.
Important findings (1) From 2000 to 2018, the vegetation spring photosynthetic phenology was significantly advanced at the rate of 0.75 d·a-1, the autumn photosynthetic phenology was delayed at the rate of 0.17 d·a-1, and the vegetation growing season length was significantly prolonged at the rate of 0.90 d·a-1. (2) The preseason maximum air temperature and minimum air temperature were the main factors affecting the advance of spring photosynthetic phenology. The autumn photosynthetic phenology of vegetation was positively correlated with preseason precipitation, minimum air temperature and radiation intensity, but negatively correlated with preseason maximum air temperature. (3) In addition, we found that the spring photosynthetic phenology of vegetation in the study area was more sensitive to climate change, especially the increase of preseason minimum air temperature led to the significant advance of spring photosynthetic phenology of evergreen needleleaf forest, evergreen broadleaf forest, bush and grassland. In conclusion, the advance of vegetation spring photosynthetic phenology in Dongting Lake basin played a dominant role in prolonging the growth season, indicating that spring photosynthetic phenology plays a more important role in enhancing the carbon sink function than the autumn photosynthetic phenology in the context of global warming. The vegetation spring photosynthetic phenology was more sensitive to climate change and the air temperature was the main factor controlling the vegetation spring photosynthetic phenology, which provides a scientific basis for the simulation and prediction of evergreen vegetation phenology.
Aims The objectives of this study were to reveal the changing trends and regional differences of vegetation fractional coverage on the Loess Plateau 20 years after the implementation of the “Grain for Green (GFG)” policy, and to quantify the contribution of climate and human activities to the change of vegetation fractional coverage and its spatial distribution in the region.
Methods The spatial and temporal variation of photosynthetic vegetation (PV) fractional coverage on the Loess Plateau from 2001 to 2020 and its drivers and contributions were analyzed based on MODIS-PV and meteorological data, and using the methods of the Mann-Kendall method, the Sen estimator, and multivariate residual trend analysis.
Important findings Regional vegetation fractional coverage increased from 40% in 2001 to 60% in 2020. Vegetation fractional coverage of the Loess Plateau showed a significant increasing trend over 20 years, with an increasing rate of 0.8%·a-1. The proportion of the area with an increasing trend of vegetation fractional coverage for the entire region was 90%, and the proportion of the area with a significant increase was 71%. The contribution to the increase of vegetation fractional coverage in the region was mainly in the loess hilly region (2/5), followed by the sandy hilly region (1/4) and the rocky mountain region (1/5). Within the different geomorphology divisions, vegetation fractional coverage in the loess hilly region increased rapidly in Yulin and Yanʼan in Shaanxi. Vegetation fractional coverage in Ordos, Nei Mongol, changed the fastest in the sandy hilly region. Human activities and climate change contributed 76% and 24%, respectively, to the increase of vegetation fractional coverage on the Loess Plateau during the study period. The areas where human activities contributed positively to vegetation fractional coverage were mainly located in the loess hilly and sandy hilly regions in the northern part of Yanʼan in Shaanxi, the southern part of Taiyuan in Shanxi, the southern part of Tongxin in Ningxia, and the hills and plateaus of Pingliang and Qingyang in Gansu where the ecological projects funded by the Chinese government have been well implemented.
Aims The Qingzang Plateau is highly sensitive to global climate change. The unique natural conditions lead to extremely vulnerable vegetation and its ecosystem, making this region ideal for analyzing responses of vegetation to climate change. However, different types of vegetation may have different responses to seasonal variability. This study explores and analyzes vegetation changes on the Qingzang Plateau and the response characteristics of different vegetation types to moisture variations (i.e., dry and wet conditions) during the growing season.Methods The standardized precipitation evapotranspiration index (SPEI) and the normalized difference vegetation index (NDVI) were used here as indicators of dry humidity and vegetation greenness, respectively. Sen’s slope estimation, BFAST model and correlation analyses were used to quantify the spatiotemporal variability of vegetation greenness and its response to drought-wet variations on the Qingzang Plateau from 2000 to 2018. Important findings Results show that vegetation greenness on the Qingzang Plateau generally increased over the time period analyzed. Additionally, the rate of spatial variation reveals striking regional differences. The breaks of vegetation greenness occurred in most regions during 2012-2015, after which there was general upward trend after the breaks, the various trend is most apparent in northern Qingzang Plateau. Positive correlations between NDVI and multi-time scale SPEI were observed in most regions during the growing season, and gradually increased in the middle and latter part of the growing season. The responses of each vegetation type to SPEI also showed a distinct periodicity during the year. Meadow and steppe areas were more sensitive to multi-time scale SPEI than forest and shrub areas, and this response differed significantly during different stages of the growing season and for different time scales of SPEI.
Aims Since the dynamic distribution of aquatic plants can reflect the variation of water ecological environment, it is of great significance to fully understand the spatial and temporal distribution characteristics of aquatic plants for better lake management and monitoring.
Methods On the basis of Landsat image data, this study calculated three vegetation indices, including normalized difference water index (NDWI), green veg index (Green), and macroalgae index (MAI), and constructed an aquatic plant extraction for the Donghu Lake of Wuhan using the decision tree classification method. With this method, we mapped the seasonal distribution of emergent/floating and submerged plants in the Donghu Lake in 2020, as well as their inter-annual variations during a 31-year period from 1990 to 2020.
Important findings Our results showed that the decision tree model is capable of determining the distribution of aquatic plants in the Donghu Lake accurately, with an overall accuracy of 82.29% and Kappa coefficient of 72.39%. The analysis of the seasonal variation of aquatic plants in the Donghu Lake reveal that the area of aquatic plants first increased and then decreased. In spite of being limited in February, the distribution area gradually expanded from April to August, and subsequently declined after October. The distribution and area of aquatic plants varies greatly, which can be divided into three stages regarding the long-term analysis. In the first stage (1990-1996), the area of emergent/floating plants decreased first and then increased, while that of submerged plants presented an increasing trend on a continued basis. In the second stage (1997-2015), the area of submerged plants and emergent/floating plants exhibited significant fluctuations from year to year. During this period, the area of aquatic plants reached a maximum of 2.61 km2, whereas the minimum of 0.49 km2. In the third stage (2016-2020), the aquatic plants in the Donghu Lake gradually recovered, leading to a 30% increase in the area of emergent/floating plants and a 18% increase in the area of submerged plants. Upon a study of the relationship between the area of aquatic plants, annual average temperature, and annual precipitation over the recent three decades, a conclusion can be drawn that annual average temperature and annual precipitation had little influence on the area of aquatic plants in the Donghu Lake. Instead, we found that environmental indicators, such as total phosphorus content, total nitrogen content, water depth, transparency, and turbidity, have significant spatial differences in the Donghu Lake, which are likely to affect the distribution of aquatic plants.
Aims Ecosystem apparent quantum yield (α) and maximum photosynthetic rate (Pmax) are important parameters reflecting the photosynthetic characteristics of ecosystem, and also important physiological parameters in ecosystem model simulation and remote sensing inversion. The objectives of this study were to: (1) analyze the characteristics and spatial-temporal variations of the light response parameters of ecosystems in arid and semi-arid areas; and (2) reveal the key factors affecting the photosynthetic parameters and its underlying mechanisms in arid and semi-arid areas, so as to provide a scientific basis for the study of ecosystem photosynthesis and response to climate change on a regional scale.
Methods The observational fluxes and synchronous meteorological data of 9 stations in arid and semi-arid area were integrated from ChinaFLUX. The non-rectangular hyperbolic equations were used to fit the light response parameters and which influencing factors were identified by linear regression, multiple stepwise regression and path analysis.
Important findings There were obvious spatial and temporal variations in ecosystem photosynthetic parameters in arid and semi-arid areas. The photosynthetic parameters increased gradually from desert, desert grassland, typical grassland to meadow grassland. Precipitation was the dominant environmental factor of the spatial variations of photosynthetic parameters, and it also affected the spatial variation of leaf area index, both of them jointly determine the spatial variation of photosynthetic parameters. α and Pmax have an obvious increasing trend with the increase of precipitation, and there was a significant negative correlation between temperature and α, but the effect of radiation on the spatial variation of photosynthetic parameters was not significant. In the growing season, Pmax and α increased first and then decreased, but the monthly variability and peak time of different vegetation types were different, the photosynthetic parameters of meadow grassland had the greatest monthly variability. The monthly dynamics of α was mainly controlled by temperature and radiation, while Pmax was regulated by temperature and radiation in desert and desert grassland, and by soil water content in typical grassland and meadow grassland. Ecosystem α were 0.000 47-0.002 12 mg·μmol-1, and Pmax were 0.11-0.78 mg·m-2·s-1 in arid and semi-arid area, which were at a low level compared with other grassland ecosystems. High temperature and low soil water supply were likely the main factors restricting the photosynthetic parameters in arid and semi-arid areas.
The protected areas are crucial to the maintenance of national ecological security and improvement of biodiversity conservation. Application of real-time, high-frequency and multi-scale ecological monitoring in the protected areas serves an effective means for identifying the dynamics of ecosystem, which is key to the implement of ecosystem health management in the protected areas. However, due to the lack of a unified ecosystem monitoring and research network and the corresponding indicator system of the protected areas in China, the composition and dynamics of ecosystem in many protected areas remains unclear, which can dimmish the ability to cope with emerging issues of biodiversity conservation. Lack of the data obtained from the ecological monitoring network can also hamper the evaluation of ecosystem health status and conservation effectiveness of the protected areas on a national scale. As such, it is necessary to construct a national scale monitoring and research network for the composition and dynamics of ecosystem in the protected areas, as well as a scientific, systematic and normative indicator system for this monitoring network. By addressing the aims and objectives of biodiversity and ecosystem monitoring in the protected areas and with reference to the indicator systems of existing ecological monitoring networks both in China and abroad, this study summarized the basic principles of establishing the indicator system and the selection of indicators. Accordingly, an indicator system for the ecosystem monitoring network of the protected areas was established and applied to 6 national nature reserves for demonstration. The established indicator system consists of 30 indicators to comprehensively monitor changes in the 6 key elements that compose an ecosystem, which is habitat, biota, meteorology, soil, atmospheric and water environment, and landscape. The indicator system was effectively applied to monitor the long-term and dynamic changes in the status and evolution of ecosystem components and structures in different ecosystem types of protected areas including forest, grassland, wetland and desert. The normalized and standardized data achieved from the established monitoring network can further be used for the evaluation of conservation effectiveness and healthy management of the protected areas.
Spectral diversity is a biodiversity dimension based on electromagnetic radiation spectrum reflected by plant, showing the variation of spectral reflective ratio in different bands among interspecific and intraspecific plant individuals. Spectral diversity has become an important technique for plant diversity monitoring and assessment since the differences of spectral reflectance can comprehensively indicate the differences of biochemical components and morphological and structural characteristics among plants. Here we introduce the concept of spectral diversity and its ecological significance, compare the technical advantages and disadvantages among multiple sources and platforms producing spectral data, summarize the monitoring and evaluation methodologies of plant diversity based on the applications of spectral diversity, and discuss the ability of spectral diversity to integrate different biodiversity dimensions and the prospect of the application of spectral diversity in biodiversity research. Spectral diversity will serve the monitoring and assessment of plant diversity at multiple spatial scales, especially combined with near-ground remote sensing based on unmanned aerial vehicle technology, can achieve fine-scale monitoring and assessment of plant diversity, and thus has broad application prospects in biodiversity conservation and management.
Solar radiation is fundamental to the maintenance and development of forest ecosystem functions and services. Therefore, modeling the radiation transfer process in forest is of great significance for understanding forest ecosystem processes. In recent years, the rapid development of three-dimensional radiative transfer models makes it possible to accurately simulate the distribution and dynamics of radiation within forest canopies. In order to better understand three-dimensional radiative transfer models and make them better serve forest ecosystem research, we review the principles, applications and future prospects of these models. Firstly, common principles of three-dimensional radiative transfer models such as radiosity and ray tracing are briefly introduced, and then the applications of three-dimensional radiative transfer models in forest ecosystem research are summarized. Finally, future opportunities of integrating multiple datasets and models to better facilitate forest ecosystem research, such as model coupling and making various models easier to use, are discussed. With the accumulation of ecological big data and improvement of ecosystem progress models, three-dimensional radiative transfer models will play a more important role in theoretical research and practices of forest ecology in the future.
Aims With increasing anthropogenic activities in coastal areas, human disturbances have been identified as major causes of the decline of coastal mangroves and undemine the sustainable development. Monitoring the spatial-temporal dynamics of typical human activities in mangrove ecosystems and adjacent areas is critical in conservation and restoration of local mangrove ecosystems.
Methods We proposed an object-oriented machine learning method based on seasonal water fluctuations, using Landsat satellite imagery on Google Earth Engine platform. Inundation frequency was incorporated as a classification feature to obtain the spatial pattern of aquaculture ponds, which is concerned as the key driver of degradation and losses of mangroves. We revealed the dynamics of aquaculture ponds at a 30 m-resolution between 1990 and 2020 in China’s coastal regions with mangrove community detected, including Guangdong, Fujian, Zhejiang, Taiwan, Guangxi, and Hainan.
Important findings The total area of coastal aquaculture ponds in 1990 was about 2 963 km2, which increased to 5 200 km2 in 2000 and 5 377 km2 in 2010, and then decreased to 4 805 km2 in 2020. The maximum appeared between 2010 and 2020, but there was a significant regional variation in the changing pattern and peaking time of coastal aquaculture ponds. Coastal aquaculture ponds were mainly concentrated in the region of 21°-24° N (Guangdong and Guangxi). The spatial pattern of mangroves was shown as a staggered arrangement to that of aquaculture ponds. Our results also indicate a symbiotic relationship between aquaculture ponds and mangroves at latitude 21°-22° N, where a large number of mangroves grow along the edges of aquaculture ponds. This special distribution of mangroves and aquaculture ponds leads to a high level of interconnections between these two ecosystems, which can be recognized as the typical areas in exploring the impacts of human activities on mangrove ecosystems. The conversion of mangroves to aquaculture ponds was the primary cause of mangrove loss, which led to the extreme fragmentation and aggregation of mangrove patches in different areas. Our research on the spatial-temporal pattern of coastal aquaculture ponds provides an accurate dataset to assess the impacts of increasing human activities on mangrove ecosystems, and may contribute to the identification of priority restoration area.
Plant functional traits are the measurable characteristics that indicates plant adaptation to the environment, and understanding the patterns of certain characteristics, and their drivers is an essential component of plant ecology and earth system modeling research. Traditional field-based approaches for characterizing plant functional traits are time-consuming, labor-intensive and expensive, and usually focus on the traits of peak growing season and dominant species, making the scaling extension and spatiotemporal coverage of plant functional traits a great challenge. In contrast, newly emerging multi-scale hyperspectral remote sensing techniques potentially provide new avenues to easily identify and characterize functional traits. Here we first overview the principles and brief history of hyperspectral remote sensing technology for plant functional traits monitoring. Then, we detailed the principal methods for modelling the spectral-trait relationships, including empirical and semi-empirical statistical methods and inversion methods relying on physical-based modelling, among which the statistical partial least squares regression is widely used. We then used case studies to demonstrate the application while illustrating the remaining problems of plant functional traits monitoring using the hyperspectral remote sensing techniques respectively at leaf, community and landscape scales. Finally, we highlight four important future directions to advance hyperspectral remote sensing of plant functional traits, including: 1) exploring the generalizability and underlying mechanisms of spectral-trait modelling; 2) developing novel, transparent methodology that scales the spectral-trait relationships from leaf, canopy to satellite levels; 3) elucidating the pattern and drivers of remotely sensed plant functional traits and diversity across various spatiotemporal scales; and 4) investigating the linkage among environment, plant functional diversity, biodiversity and ecosystem functioning.
Aims Accurately obtaining forest structural attributes is important for forest ecosystem research and protection. As a key data source, satellite remote sensing data are used to derive various regional and global products of forest structure and conditions, which are widely used in forest condition evaluation, forest biomass estimation, and forest disturbance and biodiversity monitoring. However, these products derived from satellite remote sensing data lack verification for Chinaʼs forested areas, and their accuracy and uncertainty under different forest structure and terrain conditions is not clear. Light detection and ranging (LiDAR) has the advantage of acquiring high-precision three-dimensional information. It has been widely used in monitoring forest ecosystems and validating various datasets of forest structure derived from remote sensing data. This study focused on evaluating the accuracy of Global Land Surface Satellite Products System-Leaf Area Index (GLASS LAI), Global Land Cover Facility-Tree Canopy Cover (GLCF TCC), and Global Forest Canopy Height (GFCH) products in China based on massive unmanned aerial vehicle (UAV) LiDAR data.
Methods We collected nationwide LiDAR point cloud data at 114 sites in China’s forested areas to build the benchmark validation dataset including canopy cover, canopy height and LAI. The corresponding pixel values of the above three products were extracted using the geolocation from UAV LiDAR data. The coefficient of determination (R2) and root mean square error (RMSE) were used to evaluate the accuracy and uncertainty of the three products. The uncertainty under different forest types, canopy cover and terrain conditions were also analyzed.
Important findings The results indicate that compared to the LAI, canopy cover and canopy height derived from UAV LiDAR data, GLASS LAI (R2 = 0.29, RMSE= 2.1 m2·m-2), GLCF TCC (R2= 0.47, RMSE= 31%), GFCH (R2= 0.37, RMSE = 5 m) all exhibit large uncertainties and suffer from saturation problems in China’s forested areas, and their accuracy varies significantly across forest types, canopy cover and terrain conditions. In general, the GLASS LAI and GLCF TCC are mainly influenced by forest types and canopy cover, respectively. In contrast, both slope and canopy cover have large influences on the accuracy of GFCH.
Aims The relationship between biodiversity and ecosystem function is an important ecological issue that is increasingly receiving global attention. Plant functional diversity, as one of the most important components of biodiversity, is directly linked to ecosystem functions. Traditional in-situ monitoring of grassland plant functional diversity is not only time-consuming and laborious, but also difficult to expand to large-scale research due to the limitations of time and space. The development of remote sensing technology provides an economical and effective means for assessing the grassland functional diversity over large areas. We estimated functional diversity and aboveground biomass based on Sentinel-2 satellite images and field data across the meadow steppe in the Ulgai Management Area of Xilin Gol League in Nei Mongol.
Methods We selected 46 spectral feature variables from the Sentinel-2 satellite imagery in the study area. Next, three methods, including stepwise regression, partial least squares regression (PLSR), and random forest regression (RFR) were applied to retrieve the grassland functional richness (FRic), functional evenness (FEve) and functional divergence (FDiv). Finally, the grassland aboveground biomass was also estimated using PLSR method, and the relationships between remotely sensed grassland functional diversity and grassland aboveground biomass were analyzed.
Important findings Our results showed that: (1) Band 11, optimized soil adjusted vegetation index (OSAVI), water band index (WBI) were the most important predictor of FRic; Band 6, Band 10, Band 12, carotenoid reflectance index 1 (CRI1), double-peak optical index (D), normalized difference index 45 (NDI45) were significantly related to FEve; and Band 5, Band 9, Band10, Band11, weighted difference vegetation index (WDVI), convex hull area played a critical role in predicting FDiv. (2) Based on 10-fold cross-validation, the retrieval accuracies of FRic and FEve estimated by stepwise regression were much higher than that of the other two regression methods, with R2 of 0.52 and 0.44, respectively. However, the FDiv was best estimated by PLSR (R2 = 0.61). (3) Grassland aboveground biomass was estimated with an accuracy of R2 = 0.61, and FRic was the best indicator of aboveground biomass (R2 = 0.40), followed by FDiv (R2 = 0.28) and FEve (R2 = 0.27). Our findings indicated the ability of Sentinel-2 satellite images to estimate grassland plant functional diversity, providing reference and basis for grassland plant functional diversity estimation at a large regional scale.
Aims Based on the solar-induced chlorophyll fluorescence (SIF), this study was conducted to reveal the benefit of vegetation productivity in the revegetation region with a significant increase in land surface greenness under the large-scale implementation of ecological programs in the Loess Plateau.
Methods By interpreting satellite-observed terrestrial greenness changes and land use/cover dynamics, we first identified the spatial distribution of revegetation and existing vegetation in the Loess Plateau in the last 20 years. Then, using SIF and meteorological data, the gross primary productivity (GPP) of the revegetation and existing vegetation was calculated according to the revised mechanistic light response (rMLR) model. Finally, we adopted the comparative analysis approach to compare the differences in GPP of the revegetation based on the SIF observations.
Important findings Our results indicated that the ecological programs have made a widespread increase in land surface greenness in the Loess Plateau. In the period 2001 to 2020, the area of revegetated forest was 35 000 km2, accounting for 7.42% of the total area, whereas revegetated grassland area was 110 000 km2, accounting for 25.25% of the total area. Overall, the photosynthetic capacity and vegetation productivity of the revegetated forests were lower than that of existing forests in the Loess Plateau, while revegetated grassland was higher. GPP of the revegetated forest was equivalent to 83.86% of the existing forest, and GPP of the revegetated grassland was equivalent to 121.10% of that of the existing grassland. At the same leaf area index (LAI) level, GPP of revegetation and existing vegetation showed differences that GPP gap increased as LAI became higher. Revegetation transformed from bare land showed the lowest vegetation productivity, whereas forest growth and grassland restoration from cropland were the optimal land use/cover transition pattern for the revegetated forest and revegetated grassland, respectively. LAI increasing rate and restoration time also affected the productivity of revegetation, revegetated areas with higher LAI increasing rate showed more extensive productivity benefits. Vegetation productivity of revegetated forest increased with standage, while revegetated grassland with shorter restoration periods showed higher productivity. Overall, although ecological programs have widely increased vegetation cover and biomass in the Loess Plateau, however, there exists a certain gap in GPP between the revegetation and existing vegetation areas (especially in forests), thereby affecting the ecological benefits of the ecological programs.
Recent advances in solar-induced chlorophyll fluorescence (SIF), which is a complement to optical remote sensing based on greenness observation, have made it possible to monitor the photosynthesis of plants in terrestrial ecosystems using state-of-the-art technologies. With the rapid development of tower-based, unmanned aerial vehicle (UAV), airborne and space-borne SIF observation technology and improving understanding of SIF mechanism, SIF is providing essential data support and mechanism understanding for the estimation of biological traits and gross primary production of terrestrial ecosystem, early detection of abiotic stress, extraction of photosynthetic phenology and monitoring of transpiration. In this review, we first introduce the fundamental theory, the observation systems and technologies and the retrieval method of SIF. Then, we review the applications of SIF in terrestrial ecosystem monitoring. Finally, we propose a roadmap of activities to facilitate future directions and discuss critical emerging applications of SIF in terrestrial ecosystem monitoring that can benefit from cross-disciplinary expertise.
Aims Aboveground biomass (AGB) is one of the most important factors affecting grassland ecosystem function and is commonly measured in grassland research. AGB is often measured using the harvest method, which can cause great disturbance to plant communities, especially for those long-term monitoring plots. A non-destructive method for AGB estimation is thus needed.
Methods Here, we conducted field measurements at a land-use manipulation experiment in a typical steppe in Nei Mongol, China. We obtained the fractional vegetation cover (FVC) using digital photographs. We also measured leaf area index (LAI), vegetation height, and plant species richness. Three different models were used to estimate AGB: univariate regression model, stepwise regression model, and random forest model.
Important findings We found that FVC, LAI, mean vegetation height, maximum vegetation height and richness were highly correlated with AGB variation. AGB can be accurately predicted by a stepwise regression model developed based on the local plant community. The determination coefficient (R2) and root-mean-square error (RMSE) of the stepwise regression model can reach 0.91 and 35.60 g·m-2, respectively. Overall, our study provides a rapid and non-destructive method for AGB measurement that can be used as an alternative to the traditional harvest method.
Aims Plant diversity monitoring is the basis of biodiversity assessment and developing conservation policy. Traditional forest plant diversity monitoring is mainly based on field surveys, which is difficult to quickly obtain the spatial distribution and dynamic change of forest plant diversity. The development of remote sensing technology provides an important tool for assessing forest plant diversity at the regional scale. In this study, we explored two methods of forest plant diversity estimation based on Sentinel-2A satellite images and field data in three selected national nature reserves (Liangshui, Fenglin, and Hunchun).
Methods We used two methods to estimate forest plant diversity: (1) Direct estimation based on spectral diversity at the pixel and cluster scales, respectively; (2) Indirect estimation based on random forest regression. The spectral diversity was calculated based on the coefficient of variation and convex hull area at the pixel scale, respectively. K-means clustering method was used for cluster analysis to calculate the spectral diversity between clusters. For the indirect estimation, we used 10-fold cross validation to select characteristic variables for later diversity calculation.
Important findings Our results showed that: (1) At the pixel scale, the estimation accuracy of Shannon-Wiener diversity index based on convex hull area (R2= 0.74) was better than that of coefficient of variation (R2= 0.60); (2) The pixel-based estimation accuracy of Shannon-Wiener diversity index outperformed clustering basis (R2= 0.59); (3) Based on six feature variables, the Shannon-Wiener diversity index was best estimated using the random forest regression algorithm (R2= 0.79); (4) Both the Simpson diversity index and species richness could not be accurately estimated by the above methods. Our findings indicate the capability of Sentinel-2A satellite images to estimate the Shannon-Wiener diversity index, providing reference and basis for forest plant diversity estimation at a large scale.
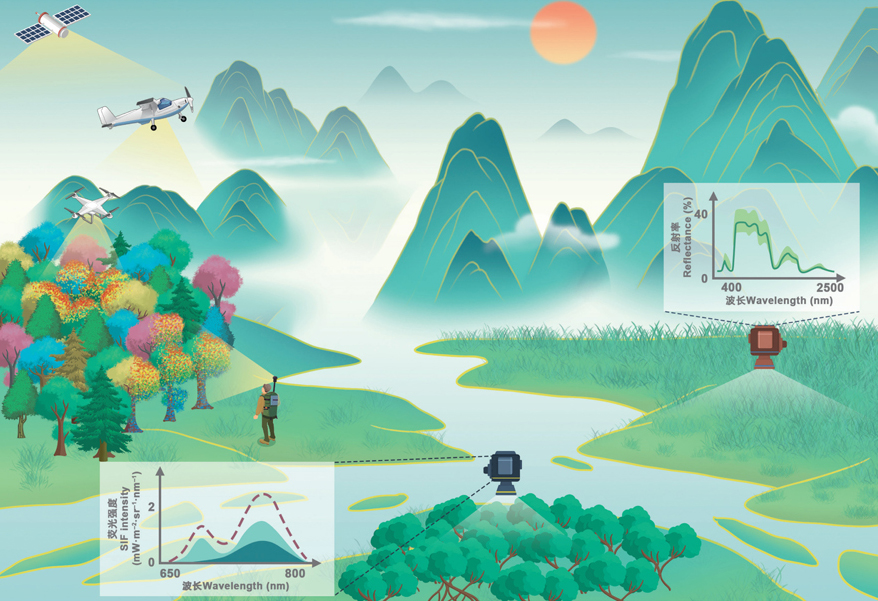
As the increasing pressure caused by climatic changes and human activities, the structure and function of terrestrial ecosystems are undergoing dramatic changes. Understanding how ecosystem processes change at large spatial-temporal scales is crucial for dealing with the threats and challenges posed by global climate change. Traditional field survey method can obtain accurate plot-level ecosystem observations, but it is difficult to be used to address large-scale ecosystem patterns and processes because of spatial and temporal discontinuities. Compared to traditional field survey methods, remote sensing has the advantages of real-time acquisition, repeated monitoring and multi spatial-temporal scales, which can compensate for the shortcomings of traditional field observation methods. Remote sensing can be used to identify the type and characteristic of ground objects, and extract key ecosystem parameters, energy flow and material circulation through retrieving the information contained by electromagnetic signals. Remote sensing data have become an indispensable data source in ecological studies, especially at the ecosystem, landscape, regional or global scales. With the emergence of new remote sensing sensors (e.g., light detection and ranging, and solar-induced chlorophyll fluorescence) and near-surface remote sensing platforms (e.g., unmanned aerial vehicle and backpack), remote sensing is entering the three-dimensional era and the observation platform become more diverse. These three-dimensional, multi-source and time-series remote sensing data bring new opportunities to fully understand ecosystem processes across different spatial scales. This paper reviews the advances of the application of remote sensing in terrestrial ecosystem studies. Specifically, this study focuses on the derivation of biological factors from remote sensing data, including vegetation types, structures, functions and biodiversity of terrestrial ecosystems. We also summarize the current status of the remote sensing technology in ecosystem studies and suggest the future opportunities of ecosystem monitoring in China.
Aims Inundation frequency (IF) is an important influencing factor on dynamics of wetland vegetation. This study analyzed the temporal and spatial variations of IF and enhanced vegetation index (EVI) of wetland vegetation and their correlation in Poyang Lake, so as to maintain the stability of wetland ecosystem.
Methods In view of the significant seasonal changes of Poyang Lake, its impact on wetland vegetation needs to be analyzed with a high temporal resolution method. Based on MODIS image data from 2000-03-01 to 2020-02-29, this study mapped the annual water inundation frequency of Poyang Lake, analyzed the temporal and spatial variations of EVI under different flooding conditions, and explored the response of EVI of wetland vegetation to changes in flooding conditions.
Important findings The following conclusions are drawn: (1) The hydrological rhythm of Poyang Lake has changed significantly in the past 20 years. The water area with high inundation frequency (IF >75%) decreased from 1 435.3 km2 in 2000 to 510.25 km2 in 2019, with a decrement of 64.45%. (2) The regional average EVI showed a significant upward trend. Vegetation expansion was mainly concentrated in the middle region of Poyang Lake which was also the main region of IF declining. (3) By analyzing the changes of average EVI value under different total IF regions, it was found that the variation trend of IF was similar to that of EVI. After 2009, the shrinking trend of the Poyang Lake water area was alleviated, and the growth rate of EVI decreased. (4) In the past 20 years, the changing trend of IF and EVI in Poyang Lake was highly consistent in spatial distribution. Wetland vegetation was mainly expanded along the decreasing direction of water area. This spatial heterogeneity further confirms that hydrological variation plays a role in regulating vegetation dynamics.
Aims Under the current global warming, there are abundant evidence that the phenological events of vegetation in spring have advanced. Advancement of the phenological events in Northern Hemisphere under a gradual warming is considered a process of acclimation rather than an instantaneous feedback. Moreover, the occurrence of spring phenological advancement also varies across ecoregions. Following up on our previous studies, here we aim to determine the temproal scale that temperature has the most influential effect on changes in spring phenology. We further explore how the local spring temperature affects the temperature sensitivity of the spring phenology and the underlying mechanism.
Methods We extracted the dates for spring phenological events by five different methods derived from the GIMMS3g normalized difference vegetation index dataset during 1982-2009. We also employed gridded climatic datasets to calculate the temperature sensitivity of the spring phenology of vegetation, and analyzed the relationship between the temperature sensitivity of phenological events of natural vegetation and environmental variables.
Important findings The spring phenological events of vegetation were mainly regulated by the early spring temperature over the mid- to high-latitude regions in the Northern Hemisphere. Specifically, we found that the maximum temperature in the month of the green-up onset or in the preceding month played the dominant role in affecting the shifts in spring phenology over 54% of the pixels for the study regions; over 91.3% of the pixels displayed phenological shifts by early spring temperature. Interestingly, across the study regions, the standard deviation in interannual temperature, accumulative precipitation and short-wave radiation contrasted in their effects, and differentially or synergistically regulated the temperature sensitivity of spring vegetation phenology.
Aims Accurate assessment of plant aboveground biomass is important for optimizing grassland resource management and for understanding the balance of carbon, water and energy fluxes in grassland ecosystems. This study constructed the optimal empirical models by near-surface remote sensing normalized difference vegetation index (NDVI) data, and then estimated plant aboveground biomass in an alpine grassland on the Qingzang Plateau.Methods Using the dataset of both the field-measured aboveground biomass and the NDVIRS observed by plant canopy spectrometer (RapidSCAN), we constructed the empirical models for estimating aboveground biomass in different phases of the growing season across 2018 and 2019. Using the NDVICam time series observed by phenology camera and the estimated models, we simulated seasonal dynamics of aboveground biomass in 2018.Important findings (1) The seasonal dynamics of NDVICam, NDVIRS and aboveground biomass exhibited a similar unimodal pattern; however, the timing of peak NDVI (August) preceded that of peak aboveground biomass (July). (2) The best model for estimating aboveground biomass is the power function in May, July and September, and the quadratic equation in June and August. The estimation accuracy ranged from 0.29 to 0.77. (3) The estimation of aboveground biomass based on the models in different phases of growing season (R2 = 0.91) showed a higher accuracy compared to that based on the model at a single time (September)(R2 = 0.49). Our results suggest that the near-surface remote sensing is an effective approach for estimating alpine grassland aboveground biomass, and further investigation on the seasonal growth of plants will help accurately evaluate grassland resources.
Aims The alpine wetland is one of the most important sites for ecological and water conservation in Qingzang Plateau, and also an effective regulator of the local climate. Research is needed to understand the dynamics and drivers of changes in this alpine wetland landscape.Methods This study was conducted with combination of methods in remote sensing image analysis, GIS spatial analysis and landscape attributes analysis. Changes in the alpine wetland patterns in Maqu County, which is located in the first meander of the Yellow River, was determined for six periodic samplings from 1995 to 2018.Important findings The alpine wetland area in Maqu County continuously degraded from 1995 to 2010, and decreased by 18 680.31 hm2 over the period. From 2010 to 2018, the wetland area increased. Compared with the level in 1990s, the wetland area has generally declined since the beginning of the 21st century. From 1995 to 2010, the patch number and density of the wetland increased continuously, but the average patch size decreased, with increased degree of landscape fragmentation. In contrast, from 2010 to 2015, the patch number and density of wetland decreased. From 2015 to 2018, the patch number and density of wetland increased, and the average patch size first increased and then decreased, with the landscape fragmentation first decreased and then increased. Both the Shannon diversity index and evenness index showed a downward trend from 1995 to 2010; the landscape structure tended to be simpler and the distribution of landscape types became more clustered. From 2010 to 2018, the Shannon diversity and evenness indices showed an upward trend; the landscape structure tended to be more complex, and the landscape types became more diverse and dispersed. Further analyses revealed that the main factors driving the changes in the alpine wetland landscape patterns in the first meander of the Yellow River are evaporation and precipitation, followed by human activities such as the population and the quantity of large livestock. Climate is the main factor driving the changes in the alpine wetland area in the first meander of the Yellow River. Intensive human economic activities have aggravated the wetland changes to some extent.
Aims Vegetation phenology is an important indicator to reflect the stages of vegetation growth, which is of great significance to the feedback to climate. Solar-induced chlorophyll fluorescence (SIF) is a by-product of photosynthesis, which provides the possibility to directly detect vegetation phenology at the global scale. In order to reveal the accuracy of phenology estimated by SIF of different forest types, we estimated phenology of three forest types in the Northern Hemisphere.
Methods Based on 35 eddy flux tower sites in the Northern Hemisphere during the period of 2007-2014, we estimated phenology of three typical forest types using SIF value and gross primary production (GPP) by double logistic growth model and dynamic threshold. Correlation analysis was used to evaluate the different potential of SIF in estimating phenology of different forest types.
Important findings Results showed that: 1) SIF was more suitable to estimate the timing of the start of growing season (SOS) than the timing of the end of growing season (EOS). 2) SOS based on SIF had the highest correlation with SOS based on GPP in mixed forests (MF). However, the SOS of deciduous broadleaf forest (DBF) and evergreen needleleaf forest (ENF) could not be accurately tracked by SIF value. 3) The preseason shortwave radiation (SR) was the primarily environmental factor of SOS.
Aims To analyse the feasibility of space-for-time method in predicting phenology shifts of Plantago asiatica and Taraxacum mongolicum on the Qinghai-Xizang Plateau, as well as revealing the phenological changes of the two herbaceous plants under climate warming.Methods The observed phenological data for Plantago asiatica and Taraxacum mongolicum from 10 sites on the Qinghai-Xizang Plateau during 2002-2011, as well as the meteorological data (i.e., daily mean air temperature) were collected. First, multiple linear regression models were bulit between geographic factors (longitude, latitude and altitude) and phenological events/annual mean temperature at different altitude gradients. Then, the longitude and latitude were kept to be unchanged, and the unary linear regression models between phenological events/annual mean temperature and altitude were built. Finally, the altitude was used as the “bridge” to indicate the relationship between the change of phenological events and the change of annual mean temperature.Important findings The temperature decreased with the increasing altitude (R2 > 0.89, p < 0.05), illustrating that changes of altitude gradients can be used to substitute for changes of annual mean temperature. The change in the simulated phenological events of the two herbaceous plants all showed a strong dependence on the change of altitude (R2 > 0.70, p < 0.05), which contributed the most among the geographic factors. Strong dependences were observed between the simulated phenological events and the simulated annual mean temperature (R2 > 0.93, p < 0.05), showing that phenological events could be predicted by the annual mean temperature with the space-for- time method. For Plantago asiatica, the first leaf date (FLD) and the first flowering date (FFD) occurred earlier with increasing annual mean temperature as 5.1 and 5.4 days per ℃, respectively, while the common leaf coloring date (LCD) occurred later as 4.8 days per ℃. The FLD and FFD of Taraxacum mongolicum advanced by 6.5 days and 7.8 days per ℃ of increase in the mean annual temperature while the LCD delayed by 6.7 days per ℃.
Aims Ecological water conveyance is of great importance for desert riparian wetland ecosystem. However, few studies have been focused on the quantitative evaluation of water conveyance to wetland restoration due to a lack of continous observation data. This paper analyzed the temporal wetland area changes between Yengisu and Alagan in the lower reach of Tarim River based on time series remote sensing data during 2000-2018, and evaluated the effects of ecological water conveyance on wetland restoration, so as to guide the ecological water conveyance and maintain the stability of the desert wetland ecosystem. Methods About 354 Landsat ETM+/TM/OLI, Sentinel 2 images during 2000-2018 were used to map the monthly wetland area changes in the lower reach of Tarim River, then their annual, seasonal and spaital areal changes were analyzed. The correlation between wetland area changes and ecological water conveyance, underground water levels were also evaluated based on Pearson correlation and cross-correlation methods. Important findings The wetland area has steadly increased in the last 19 years. The areal change rate was minor before 2011 while rapidly increased after 2011. The wetland expanded at a high rate during 2011-2013 and 2017-2018. Different ecological water volumes and water conveyance patterns (single channel or dual channel) can explain different areal changing rates at different stages. The correlation analysis between wetland area changes and ecological water volumes showed that the accumulative ecological water volume is the primary reason causing wetland expansion in recent years. In order to maintain a steady improvement of wetland vegetation, more than 350 million square meters of ecological water are conveyed to the downstream of the Tarim River through dual channel. When the groundwater depth is maintained between -5.0- -3.5 m, the wetland vegetation can sustain a good growth condition.
Aims Monitoring forest species diversity continuously and efficiently is important to maintain ecosystem services and achieve sustainability and conservation goals. In this paper, we explored the relationship between leaf biochemical and spectral properties and their inner linkage with species diversity, then estimated the forest species diversity based on a clustering algorithm using airborne imaging spectroscopy and Light Detection and Ranging (LiDAR) data in the Gutianshan National Nature Reserve of China. Methods Firstly, we isolated individual tree crowns (ITCs) with the watershed algorithm from the LiDAR data. Then we calculated the optimal vegetation indices (VIs) representing the key biochemical properties from the hyperspectral data and selected optimal structural parameters from commonly used LiDAR-derived structural parameters based on correlation and stepwise regression analysis with the field samples. Finally, a self-adaptive Fuzzy C-Means (FCM) clustering algorithm was applied to map the species diversity (i.e. Richness, Shannon-Wiener index and Simpson index) in the study area for each 20 m × 20 m moving window. Important findings The results indicated that biochemical components (chlorophyll a & b, total carotenoids, equivalent water thickness, specific leaf area, cellulose, lignin, nitrogen, phosphorus and carbon) could be well quantified by leaf spectrum using partial least squares regression (R2 = 0.60-0.79, p < 0.01), and represented by hyperspectral VIs, namely, Transformed Chlorophyll Ratio Index/Optimization of Soil-adjusted Vegetation Index (TCARI/OSAVI), Carotenoid Reflectance Index (CRI), Water Band Index (WBI), Ratio Vegetation Index (RVI), Photochemical Reflectance Index (PRI) and Canopy Chlorophyll Concentration Index (CCCI). The individual tree isolation showed high accuracy (R 2 = 0.77, RMSE = 16.48). The correlation and stepwise regression analysis showed tree height and skewness were the optimal structural parameters among seven commonly used forest structural parameters (R 2 = 0.32, p < 0.01). The species diversity indices calculated from the self-adaptive FCM clustering algorithm based on the six VIs and two optimal structural parameters correlated well with the field measurements (species richness, R 2 = 0.56, RMSE = 1.81; Shannon-Wiener index, R 2 = 0.83, RMSE = 0.22; Simpson index, R 2 = 0.85, RMSE = 0.09). With the clustering method combined with crown-by-crown variations in hyperspectral biochemical VIs and LiDAR-derived structural parameters, we created continuous maps of forest species diversity in the examined subtropical forest without the need to identify specific tree species. Our case study in Gutianshan showed the potential of airborne hyperspectral and LiDAR data in mapping species diversity of the subtropical evergreen broad-leaved forest. It could also provide a pathway for monitoring the state and changes of forest biodiversity at regional scales.
Aims The distribution pattern of green vegetation in urban streets has significant impacts on urban ecological environment and physical/mental health of local residents. Accurate detecting and monitoring of street green information is of great significance for precise urban planning and management, while there are few studies focusing on urban greenery estimation using profile image system. Methods In this study, combining network information capturing and geospatial information analysis technology, Taiʼan city was selected as the case study area. Based on the Baidu application programming interface (API), a total of 3 276 Baidu Street View (BSV) images of 273 research samples were obtained and processed, and the green vegetation pixels in the image were extracted by computer supervised classification and compared with the artificial extraction results. Based on the proposed Baidu Street Vegetation Distribution Index (BSVDI), we monitored the street vegetation’s distribution characteristics from the pedestrian perspective, and analyzed the street- scale vegetation distribution pattern. Important findings The BSV image could be used as the main data source to monitor the distribution of green trees and lawns in pedestrian’s perspective on the street scale. BSVDI was higher in the center, northeast and southeast of the study area than the other regions. BSVDI and remote sensing extracted vegetation covered area are significantly and positively correlated, with correlation coefficient of 0.76, 0.63 and 0.49 in the buffered distance of 10, 20 and 50 m, respectively. However, the change trends of the BSVDI and remote sensing results were not completely consistent in each study site. This study implies that the combination of BSVDI and remote sensing monitoring results can better guide urban green landscape planning and precise management.
Aims Water use efficiency (WUE) is a key index to measure the coupling degree of carbon and water cycle in ecosystems. The WUE of vegetation in Tianshan Mountains in Xinjiang and the north and south sites of the main oasis was estimated and then the spatio-temporal distribution of vegetation WUE was analyzed to explore its influencing factors, which will be of great significance to the protection of ecosystem and the rational utilization and development of agricultural water resources in this region. Methods This study used data from moderate-resolution imaging spectroradiometer (MODIS), meteorological and land use type data to estimate the vegetation WUE. The spatio-temporal characteristics of vegetation WUE were analyzed in Tianshan Mountains in Xinjiang over the last 18 years, and the relationship of WUE with climatic factors was evaluated. Important findings The results indicated that: (1) From 2000 to 2017, the average annual vegetation WUE for Tianshan Mountains in Xinjiang was 1.11 g·mm -1·m -2, ranging from 0.84 to 1.34 g·mm -1·m -2. As a whole, the annual decrease trend of vegetation WUE was 0.014 1 g·mm -1·m -2·a -1, and vegetation WUE showed a strong vertical zonality in Tianshan Mountains in Xinjiang, as indicated by the decrease with the altitude above 1 000 m. (2) The vegetation WUE in Tianshan Mountains in Xinjiang showed a unimodal change pattern with significant seasonal difference, in order of summer > spring > autumn > winter. (3) Correlation analysis and statistical results indicated that the dynamic change of vegetation WUE in Tianshan Mountains in Xinjiang was closely related to temperature and rainfall. The regions with vegetation WUE changes resulting from non-climate factors accounted for 39.26% in Tianshan Mountains in Xinjiang. However, the factors of temperature and precipitation contributed to the change of vegetation WUE as 33.23% and 8.57%, respectively. On the other hand, the combination of temperature and precipitation with heavy impact and light impact contributed to WUE by 5.63% and 13.13%, respectively. Overall, temperature played the most important role among all climate factors in the changes in vegetation WUE. (4) The WUE of paddy field and dryland decreased continuously with time, and these areas were mainly affected by non-climatic factors, suggesting the irrationality in local human activities.
AimsAlpine desert, as the top part of the vertical vegetation spectrum of the Qinghai-Xizang Plateau, is widely distributed in the high altitude zones in the Qilian Mountains (QLM). Its distribution and growth conditions are different from the surrounding area. It is more sensitive to climate change but rarely being studied. In this study, we focused on the dynamic changes and spatiotemporal differences of the alpine desert belt in the QLM under the warming climates from the 1990s to the 2010s.MethodsThe distribution changes in the alpine desert belt in the QLM during the past three decades were obtained from the thematic mapper and the operational land imager remote sensing digital images by using the decision tree classification and artificial visual interpretation. Spatiotemporal differences of the alpine desert distribution were studied by the overlay analysis. Meanwhile, the relationships between the changes and climates were explored using correlation analysis. Important findings The results indicated that the alpine desert shrank gradually and lost its area by approximately 348.3 km2·a-1 in the QLM with climate warming in the past 30 years. The amplitude of the shrinkage increased from east to west. However, its areas expanded in some sections. Collectively, the low boundary of the alpine desert belt moved upwards to higher altitudes at a velocity of 15 m per decade. The maximum upward-shifting amplitude lied in the western QLM, followed by the eastern and middle QLM. The vertical zonal shifting was modulated by topography-induced difference in local hydrothermal conditions. The distribution shifts in the alpine desert belt were mainly concentrated in the gentle slope regions. Because of the differences of hydrothermal background, the position shifts were greater in the sunny aspects than in the shady aspects in the eastern and middle QLM, while opposite in the western QLM. The differences in the hydrothermal conditions and regional topography led to the spatiotemporal change differences of the alpine desert distribution. The correlation between the normalized differential vegetation index and climate factors in the transition zone showed that temperature was the main factor affecting the dynamics and spatial differences of the alpine desert belt in the QLM, and climate warming facilitated the alpine meadow below the alpine desert belt by releasing the low temperature limitation on the vegetation growth.
Aims Screening of spectral characteristic variables is one of the important means for aquatic plant recognition, and it is widely applied in aquatic plant species identification. In this paper, a method for identifying aquatic plants species was constructed by combining extracted spectral feature information with the multi-temporal Landsat 8 OLI image data analysis.
Methods In analyzing reflectance spectra of aquatic plants, the method of continuum removal for mineral analysis was introduced. The spectral resampling was performed on the measured spectral curve, and the spectral absorption depth was characterized by the continuous removal of the spectral resampling results. One-way ANOVA method was used to compare the seven spectral resampling bands and the three continuum removal absorption depth sensitive bands. Then the characteristic bands with significant differentiation of different aquatic plants were selected. The continuum removal was applied on remote sensing image processing. The results of the spectroscopic analysis were used to guide the identification of aquatic plants in using Landsat 8 OLI. The classification of aquatic plants was carried out by using support vector machine (SVM) classification.
Important findings The results of the measured spectrum resampling are similar to the atmospheric calibration of Landsat 8 OLI in the same position, and the results of the measured spectral curves can be used to guide the classification of Landsat 8 OLI. The one-way ANOVA method was used to compare seven spectral resampling bands and three continuous systems in absorbing sensitive wavelengths. The results showed that the short wave infrared 1 band, which was processed by continuum removal (SWIR1CR), was the best in distinguishing different types of aquatic plants. In this paper, the continuum removal was applied on remote sensing image processing, and it was found that the SWIR1CR band can better distinguish the submerged plants and the emergent plants. The normalized differential vegetation index and SWIR1CR band were well capable of identifying submerged plants, floating plants and emergent plants. Based on the SVM classification method, the classification accuracies of aquatic plants were 86.33%. The distribution of aquatic plants showed that the aquatic plants were mainly distributed in shallow water areas of the south north bank of Guanting reservoir. When the aquatic plant distribution area reached the peak, it accounted for about 35.13% of the total area of the reservoir. The growth distribution of submerged plants changed significantly during a year. The stem and leaves of submerged plants began to emerge in early June. Aquatic plants began to wither in October, and aquatic plants accounted for only 20% of the total area in November.
Aims Linear models have been widely used to examine the impacts of climatic factors on plant phenology, although the relationship between phenology and climate could be nonlinear. Based on survival analysis, robust nonlinear models were empirically developed to examine the phenological changes in relation to air temperature and precipitation for the grasslands in China and individual woody plants in Europe.
Methods Three datasets were used in our survival analysis: two datasets of the remotely-sensed vegetation phenology for grasslands in Nei Mongol grasslands and meadows in Qinghai-Xizang Plateau, and a dataset of the phenological observations of individual woody plants in Europe. Monte Carlo simulations were performed to estimate model parameters in our survival analysis.
Important findings The survival analysis appeared to be a powerful tool in modeling the nonlinear changes in green-up date (GUD) to the climatic factors. The analyses showed that both spring temperature and precipitation are significantly correlated with the GUD in the semi-arid grasslands in Nei Mongol. For Qinghai-Xizang Plateau and Europe, the spring temperature seemed highly correlated with GUD, while the correlation was weak with the higher Holdridge aridity index. The survival model predicted that the GUD in the three regions would be advanced by 1-6 days with an increase in temperature of 1 °C. A combined increase in spring temperature and precipitation would lead to nonlinear responses, suggesting the need for developing nonlinear models. Our empirical exercise in this study demonstrated that the survival analysis could offer an alternative tool for predicting plant phenology under the changing climate.
Aims Vegetation water content is an important biophysical property of terrestrial vegetation, and its remote estimation can be utilized for real-time monitoring of vegetation drought stress. This paper reviewed and summarized the conception and research progress of four commonly used vegetation water indicators: canopy water content, leaf equivalent water thickness, live fuel moisture content, and relative water content. The advantage and disadvantage of various research methods were evaluated by estimating vegetation water content and identifying the limitation in monitoring vegetation water content using optical hyperspectral remote sensing techniques. Finally, the future research tasks were discussed to address issues on accurate monitoring, early warning and evaluation of vegetation drought stress.
JIPB
Journal of Plant Ecology
Journal of Systematics and Evolution
Biodiversity Science
Bulletin of Botany

 Ecological remote sensing and application