
植物生态学报 ›› 2021, Vol. 45 ›› Issue (1): 38-50.DOI: 10.17521/cjpe.2020.0176
哈努拉•塔斯肯1, 蔡慧颖2,3, 金光泽1,3,*( )
)
收稿日期:2020-05-29
接受日期:2020-08-28
出版日期:2021-01-20
发布日期:2020-12-09
通讯作者:
ORCID: 金光泽: 0000-0002-9852-0965
基金资助:
Hanula TASIKEN1, CAI Hui-Ying2,3, JIN Guang-Ze1,3,*()
Received:2020-05-29
Accepted:2020-08-28
Online:2021-01-20
Published:2020-12-09
Contact:
JIN Guang-Ze
Supported by:摘要:
阔叶红松(Pinus koraiensis)林是东北东部山区的地带性森林植被, 阐明其生产力的影响因素, 对于理解温带森林生产力维持机制具有重要意义。该研究依托小兴安岭典型阔叶红松林9 hm2动态监测样地, 基于2005和2015年的30 m × 30 m样方内所有胸径>6.5 cm的木本植物的调查数据, 计算各样方的树冠结构复杂性、物种多样性和林分胸高断面积, 结合各样方的地形和土壤理化性质数据, 拟合结构方程模型, 定量分析影响典型阔叶红松林生产力的直接和间接因素。研究结果显示: 树冠结构复杂性和物种多样性与生产力显著正相关, 且树冠结构复杂性对生产力的影响显著高于物种多样性; 树冠结构复杂性对生产力的作用分为树冠垂直分层和树冠可塑性, 其中树冠垂直分层是树冠结构复杂性影响阔叶红松林生产力的主要因素, 而树冠可塑性无显著影响; 林分胸高断面积与生产力显著正相关, 其解释权重仅次于树冠结构复杂性, 树冠结构复杂性与物种多样性均通过影响林分胸高断面积对阔叶红松林生产力产生间接影响; 考虑不同树冠结构复杂性时, 坡度和土壤全磷含量代表的环境因素在调节生产力上发挥的作用存在差异, 移除树冠垂直分层的作用后两者与生产力呈显著的负相关关系。综上可知, 在典型阔叶红松林中, 树冠结构复杂性比物种多样性更有效地解释了生产力的变化, 同时不可忽视其他生物和非生物因素对生产力的作用。
哈努拉•塔斯肯, 蔡慧颖, 金光泽. 树冠结构对典型阔叶红松林生产力的影响. 植物生态学报, 2021, 45(1): 38-50. DOI: 10.17521/cjpe.2020.0176
Hanula TASIKEN, CAI Hui-Ying, JIN Guang-Ze. Effects of canopy structure on productivity in a typical mixed broadleaved-Korean pine forest. Chinese Journal of Plant Ecology, 2021, 45(1): 38-50. DOI: 10.17521/cjpe.2020.0176
| 尺度 Scale | 比较拟合指数 CFI | 标准均方根残差 SRMR | 渐进残差均方和平方根 RMSEA | 赤池信息准则 AIC | p |
|---|---|---|---|---|---|
| 10 m × 10 m | 1 | 0.006 | 0 | 12 400.938 | 0.653 |
| 20 m × 20 m | 0.99 | 0.026 | 0.065 | 3 105.839 | 0.118 |
| 30 m × 30 m | 1 | 0.020 | 0 | 1 308.250 | 0.720 |
附录I 不同尺度下生产力最优结构方程模型拟合结果
Supplement I Results of the best-fit structural equation models (SEMs) of productivity at varying scales
| 尺度 Scale | 比较拟合指数 CFI | 标准均方根残差 SRMR | 渐进残差均方和平方根 RMSEA | 赤池信息准则 AIC | p |
|---|---|---|---|---|---|
| 10 m × 10 m | 1 | 0.006 | 0 | 12 400.938 | 0.653 |
| 20 m × 20 m | 0.99 | 0.026 | 0.065 | 3 105.839 | 0.118 |
| 30 m × 30 m | 1 | 0.020 | 0 | 1 308.250 | 0.720 |
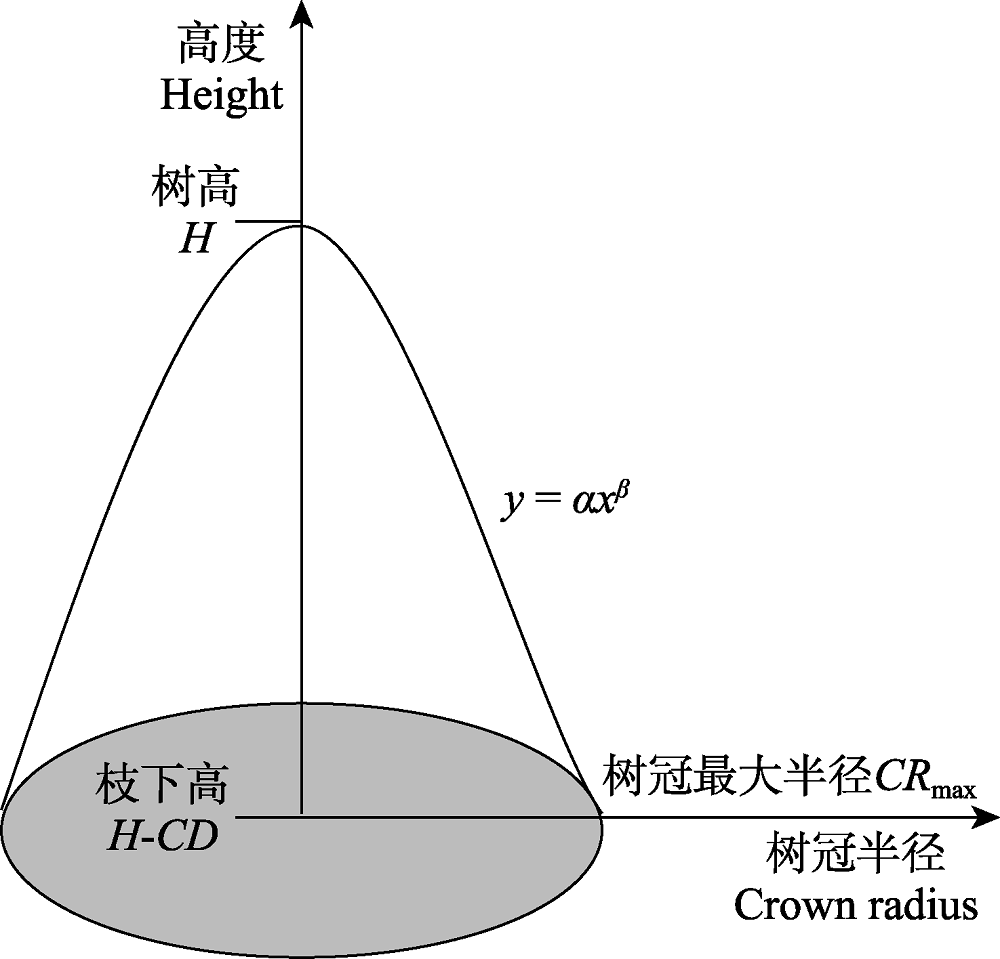
图1 树冠体积的示意图。y = αx β表示树冠形状拟合的抛物线公式, β为冠形参数。
Fig. 1 Schematic illustration of crown volume of a tree. CRmax, the maximum of radius of crown; H, tree height; H-CD, under branch height. The shape of the crown is determined by equation y = αx β, and β is the shape parameter which determines the curvature of the crown.
| 变量 Variable | 平均值 Mean | 标准差 SD | 范围 Range | ||||
|---|---|---|---|---|---|---|---|
| Shannon多样性指数 Shannon diversity index | 0.41 | 0.30 | 0.12-1.50 | ||||
| Simpson多样性指数 Simpson diversity index | 0.18 | 0.12 | 0.06-0.54 | ||||
| 均匀度指数 Evenness index | 0.15 | 0.12 | 0.04-0.58 | ||||
| 物种丰富度指数 Species richness index | 9.48 | 1.99 | 5-16 | ||||
表1 典型阔叶红松林样地物种多样性指数统计表
Table 1 Summary of species diversity index in a typical mixed broadleaved-Korean pine forest plot
| 变量 Variable | 平均值 Mean | 标准差 SD | 范围 Range | ||||
|---|---|---|---|---|---|---|---|
| Shannon多样性指数 Shannon diversity index | 0.41 | 0.30 | 0.12-1.50 | ||||
| Simpson多样性指数 Simpson diversity index | 0.18 | 0.12 | 0.06-0.54 | ||||
| 均匀度指数 Evenness index | 0.15 | 0.12 | 0.04-0.58 | ||||
| 物种丰富度指数 Species richness index | 9.48 | 1.99 | 5-16 | ||||
| 环境因子 Environmental factor | 平均值 Mean | 标准差 SD | 变异系数 CV | 范围 Range | |||||||||||
|---|---|---|---|---|---|---|---|---|---|---|---|---|---|---|---|
| 海拔 Elevation (m) | 463.22 | 18.07 | 0.04 | 427.93-499.07 | |||||||||||
| 坡度 Slope (°) | 15.30 | 4.67 | 0.31 | 8.10-33.40 | |||||||||||
| 坡向 Aspect (sin) | 0.02 | 0.72 | 36.00 | -0.997-0.994 | |||||||||||
| 坡向 Aspect (cos) | -0.07 | 0.70 | -10.00 | -0.999-0.999 | |||||||||||
| 凹凸度 Convex | 0.06 | 1.05 | 17.50 | -1.55-4.45 | |||||||||||
| 土壤速效磷含量 Soil available phosphorus content (mg·kg-1) | 8.83 | 6.04 | 0.68 | 3.53-43.11 | |||||||||||
| 土壤速效钾含量 Soil available potassium content (mg·kg-1) | 332.61 | 52.69 | 0.16 | 200.87-485.34 | |||||||||||
| 土壤速效氮含量 Soil available nitrogen content (mg·kg-1) | 1 103.60 | 147.95 | 0.13 | 666.56-1 450.17 | |||||||||||
| 土壤有机碳含量 Soil organic carbon content (g·kg-1) | 75.75 | 29.71 | 0.39 | 37.63-186.29 | |||||||||||
| 土壤全氮含量 Soil total nitrogen content (g·kg-1) | 8.40 | 1.46 | 0.17 | 5.22-11.70 | |||||||||||
| 土壤全磷含量 Soil total phosphorus content (g·kg-1) | 0.82 | 0.13 | 0.16 | 0.44-1.13 | |||||||||||
| 土壤pH Soil pH | 5.77 | 0.15 | 0.03 | 5.47-6.19 | |||||||||||
| 土壤容重 Soil bulk density (g·cm-3) | 0.62 | 0.09 | 0.15 | 0.43-0.85 | |||||||||||
| 体积含水率 Soil volumetric moisture content (%) | 30.35 | 5.37 | 0.18 | 15.44-44.06 | |||||||||||
| 质量含水率 Soil mass moisture content (g·g-1) | 0.92 | 0.22 | 0.24 | 0.55-1.40 | |||||||||||
表2 典型阔叶红松林样地地形和土壤物理化学性质状况统计表
Table 2 Summary of topographic factors and soil physical and chemical properties in a typical mixed broadleaved-Korean pine forest plot
| 环境因子 Environmental factor | 平均值 Mean | 标准差 SD | 变异系数 CV | 范围 Range | |||||||||||
|---|---|---|---|---|---|---|---|---|---|---|---|---|---|---|---|
| 海拔 Elevation (m) | 463.22 | 18.07 | 0.04 | 427.93-499.07 | |||||||||||
| 坡度 Slope (°) | 15.30 | 4.67 | 0.31 | 8.10-33.40 | |||||||||||
| 坡向 Aspect (sin) | 0.02 | 0.72 | 36.00 | -0.997-0.994 | |||||||||||
| 坡向 Aspect (cos) | -0.07 | 0.70 | -10.00 | -0.999-0.999 | |||||||||||
| 凹凸度 Convex | 0.06 | 1.05 | 17.50 | -1.55-4.45 | |||||||||||
| 土壤速效磷含量 Soil available phosphorus content (mg·kg-1) | 8.83 | 6.04 | 0.68 | 3.53-43.11 | |||||||||||
| 土壤速效钾含量 Soil available potassium content (mg·kg-1) | 332.61 | 52.69 | 0.16 | 200.87-485.34 | |||||||||||
| 土壤速效氮含量 Soil available nitrogen content (mg·kg-1) | 1 103.60 | 147.95 | 0.13 | 666.56-1 450.17 | |||||||||||
| 土壤有机碳含量 Soil organic carbon content (g·kg-1) | 75.75 | 29.71 | 0.39 | 37.63-186.29 | |||||||||||
| 土壤全氮含量 Soil total nitrogen content (g·kg-1) | 8.40 | 1.46 | 0.17 | 5.22-11.70 | |||||||||||
| 土壤全磷含量 Soil total phosphorus content (g·kg-1) | 0.82 | 0.13 | 0.16 | 0.44-1.13 | |||||||||||
| 土壤pH Soil pH | 5.77 | 0.15 | 0.03 | 5.47-6.19 | |||||||||||
| 土壤容重 Soil bulk density (g·cm-3) | 0.62 | 0.09 | 0.15 | 0.43-0.85 | |||||||||||
| 体积含水率 Soil volumetric moisture content (%) | 30.35 | 5.37 | 0.18 | 15.44-44.06 | |||||||||||
| 质量含水率 Soil mass moisture content (g·g-1) | 0.92 | 0.22 | 0.24 | 0.55-1.40 | |||||||||||
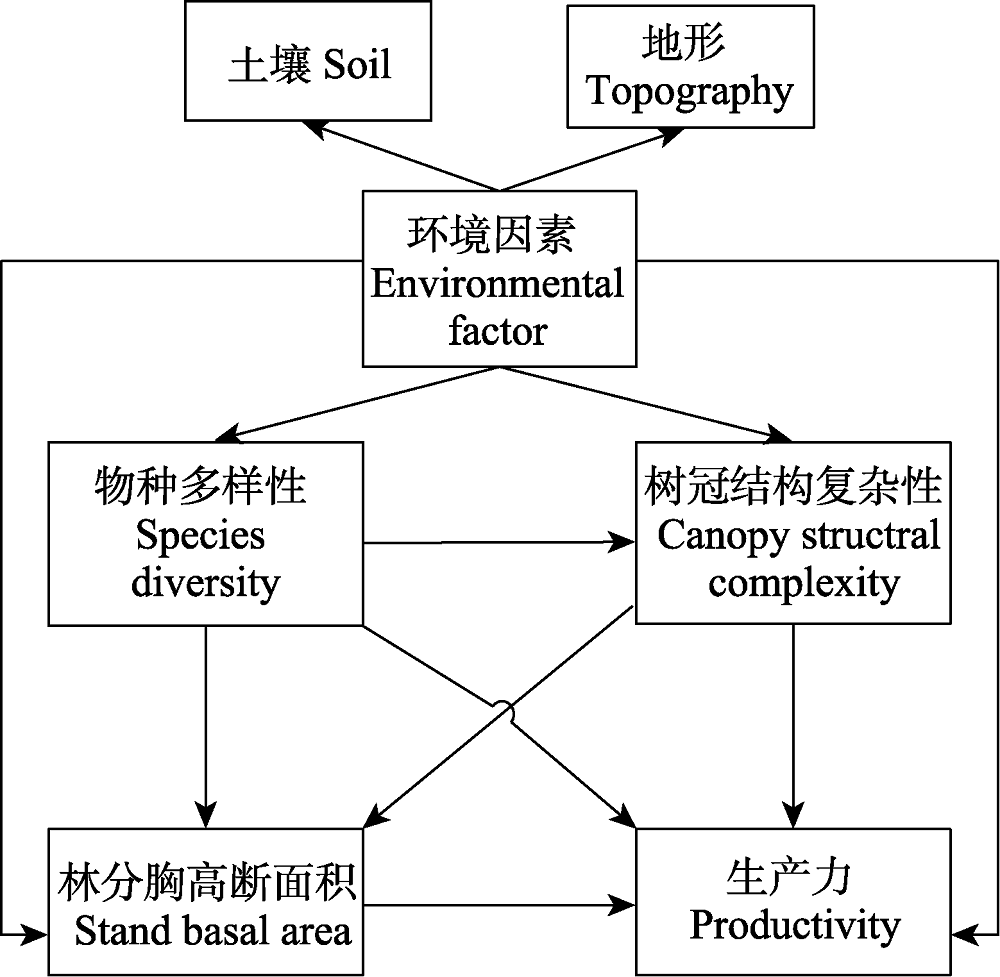
图2 阔叶红松林环境因素、物种多样性、树冠结构复杂性、林分胸高断面积与生产力之间多元关系的概念模型。其中环境因素为潜变量, 包括土壤理化性质和地形因子。
Fig. 2 A conceptual model of hypothesized causal pathways linking the environmental factor, species diversity, canopy structural complexity, stand basal area, and productivity in a mixed broadleaved-Korean pine forest. The environmental factor is a latent variable consisting of soil physical and chemical properties and topography.
| 解释变量 Explanatory variable | 变量重要性 Variable importance | 含变量模型 Containing model |
|---|---|---|
| 均匀度指数 Evenness index | 0.65 | 5 |
| Simpson多样性指数 Simpson diversity index | 0.39 | 3 |
| Shannon多样性指数 Shannon diversity index | 0.28 | 2 |
| 物种丰富度指数 Species richness index | 0.19 | 2 |
| 坡度 Slope | 0.81 | 4 |
| 海拔 Elevation | 0.56 | 3 |
| 坡向 Aspect (sin) | 0.41 | 2 |
| 坡向 Aspect (cos) | 0.16 | 1 |
| 土壤全磷含量 Soil total phosphorus content | 1.00 | 8 |
| 土壤速效氮含量 Soil available nitrogen content | 1.00 | 8 |
| 土壤速效磷含量 Soil available phosphorus content | 1.00 | 8 |
| 体积含水率 Soil volumetric moisture content | 0.91 | 7 |
| 土壤容重 Soil bulk density | 0.49 | 4 |
| 土壤速效钾含量 Soil available potassium content | 0.22 | 2 |
| 质量含水率 Soil mass moisture content | 0.11 | 1 |
| 土壤全氮含量 Soil total nitrogen content | 0.10 | 1 |
附录II 典型阔叶红松林与生产力建立多重回归模型中各变量的相对重要性结果
Supplement II Results of the relative importance of each variable in multiple regression model with productivity in typical mixed broadleaved-Korean pine forest
| 解释变量 Explanatory variable | 变量重要性 Variable importance | 含变量模型 Containing model |
|---|---|---|
| 均匀度指数 Evenness index | 0.65 | 5 |
| Simpson多样性指数 Simpson diversity index | 0.39 | 3 |
| Shannon多样性指数 Shannon diversity index | 0.28 | 2 |
| 物种丰富度指数 Species richness index | 0.19 | 2 |
| 坡度 Slope | 0.81 | 4 |
| 海拔 Elevation | 0.56 | 3 |
| 坡向 Aspect (sin) | 0.41 | 2 |
| 坡向 Aspect (cos) | 0.16 | 1 |
| 土壤全磷含量 Soil total phosphorus content | 1.00 | 8 |
| 土壤速效氮含量 Soil available nitrogen content | 1.00 | 8 |
| 土壤速效磷含量 Soil available phosphorus content | 1.00 | 8 |
| 体积含水率 Soil volumetric moisture content | 0.91 | 7 |
| 土壤容重 Soil bulk density | 0.49 | 4 |
| 土壤速效钾含量 Soil available potassium content | 0.22 | 2 |
| 质量含水率 Soil mass moisture content | 0.11 | 1 |
| 土壤全氮含量 Soil total nitrogen content | 0.10 | 1 |
| 模型 Model | CFI | SRMR | RMSEA | AIC | p | ||
|---|---|---|---|---|---|---|---|
| 树冠结构复杂性 Canopy structural complexity | 1 | 0.020 | 0 | 1 308.25 | 0.720 | ||
| 树冠垂直分层 Canopy vertical stratification | 1 | 0.019 | 0 | 1 295.63 | 0.568 | ||
| 树冠可塑性 Canopy plasticity | 1 | 0.021 | 0 | 1 346.06 | 0.755 | ||
表3 典型阔叶红松林最优结构方程模型检验多样性与生产力关系的结果
Table 3 Results of the best-fit structural equation models (SEMs) testing the relationships between forest productivity and diversity in a typical mixed broadleaved-Korean pine forest
| 模型 Model | CFI | SRMR | RMSEA | AIC | p | ||
|---|---|---|---|---|---|---|---|
| 树冠结构复杂性 Canopy structural complexity | 1 | 0.020 | 0 | 1 308.25 | 0.720 | ||
| 树冠垂直分层 Canopy vertical stratification | 1 | 0.019 | 0 | 1 295.63 | 0.568 | ||
| 树冠可塑性 Canopy plasticity | 1 | 0.021 | 0 | 1 346.06 | 0.755 | ||
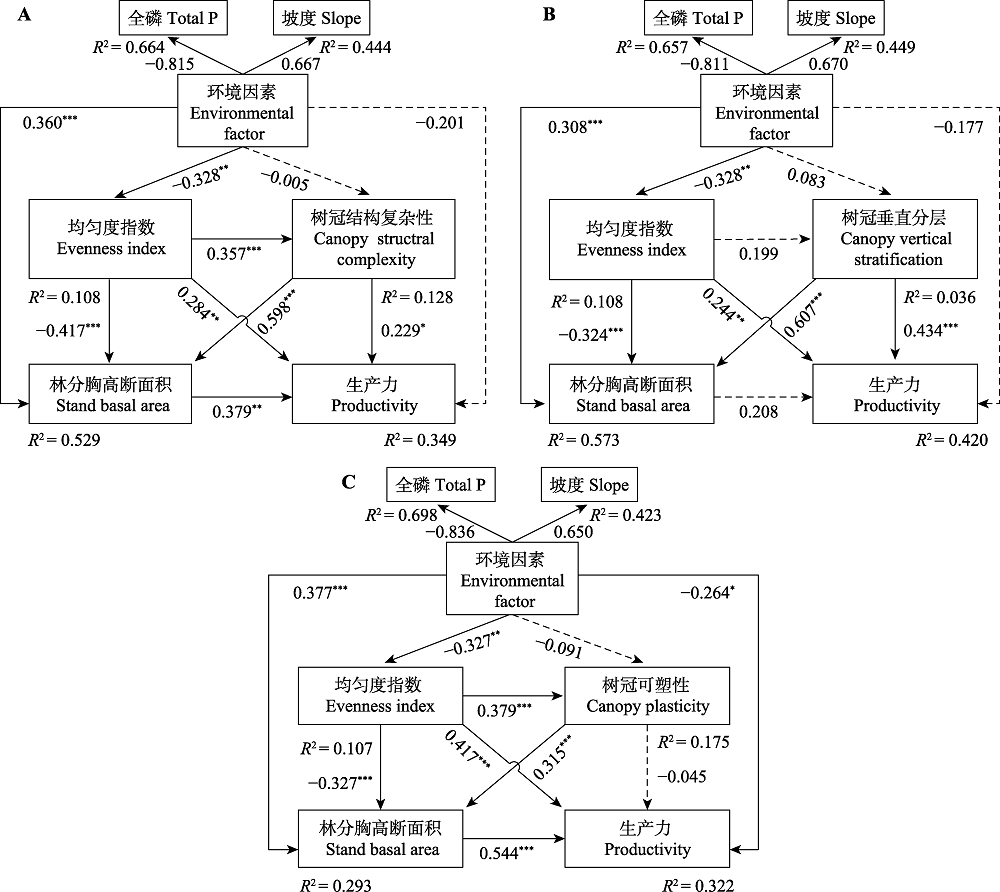
图3 阔叶红松林树冠结构复杂性、均匀度指数、林分胸高断面积、环境因素(土壤全磷(P)和坡度结合的潜变量)与生产力之间的结构方程模型。A, 考虑树冠结构复杂性的模型。B, 考虑树冠垂直分层的模型。C, 考虑树冠可塑性的模型。图中实线表示作用路径显著, 虚线表示作用路径不显著。箭头旁边的值是每个路径的标准化回归系数和显著性。R2表示由组合自变量解释的因变量的总变化。*, p < 0.05; **, p < 0.01; ***, p < 0.001。
Fig. 3 Structural equation models (SEMs) for linking multivariate relationships among canopy structural complexity, evenness index, stand basal area, environmental factor (a latent variable of soil total phosphorus (P) and slope), and productivity in typical mixed broadleaved-Korean pine forest. A, Considering canopy structural complexity. B, Considering canopy vertical stratification. C, Considering canopy plasticity in the structural equation model. Solid lines indicate significant paths, and dash lines indicate insignificant paths. Standardized regression coefficients and significance are shown next to the arrow for each path. R2 indicates the total variation in a dependent variable explained by the combined independent variables. *, p < 0.05; **, p < 0.01; ***, p < 0.001.
| 预测因子 Predictor | 直接效应 Direct effect | 间接效应途径 Pathways of indirect effect | 间接效应 Indirect effect | 总效应 Total effect |
|---|---|---|---|---|
| 环境因子 Environmental factor | -0.201 (p > 0.05) | 总计 Summed | 0.042 (p > 0.05) | -0.159 (p > 0.05) |
| 通过均匀度指数 Via EI | -0.093 (p > 0.05) | |||
| 通过树冠结构复杂性 Via CSC | -0.001 (p > 0.05) | |||
| 通过林分胸高断面积 Via SBA | 0.137 (p= 0.021) | |||
| 均匀度指数 EI | 0.284 (p= 0.006) | 总计 Summed | -0.077 (p > 0.05) | 0.207 (p= 0.036) |
| 通过树冠结构复杂性 Via CSC | 0.082 (p > 0.05) | |||
| 通过林分胸高断面积 Via SBA | -0.158 (p= 0.008) | |||
| 树冠结构复杂性CSC | 0.229 (p= 0.045) | 总计 Summed | 0.227 (p= 0.004) | 0.455 (p< 0.001) |
| 通过林分胸高断面积 Via SBA | 0.227 (p= 0.004) | |||
| 林分胸高断面积 SBA | 0.379 (p= 0.002) | 0.379 (p= 0.002) |
表4 均匀度指数、树冠结构复杂性、林分胸高断面积和环境因素对典型阔叶红松林生产力的直接、间接和总效应
Table 4 Direct, indirect, and total standardized effects of evenness index (EI), canopy structural complexity (CSC), stand basal area (SBA) and environmental factor on productivity in a typical mixed broadleaved-Korean pine forest
| 预测因子 Predictor | 直接效应 Direct effect | 间接效应途径 Pathways of indirect effect | 间接效应 Indirect effect | 总效应 Total effect |
|---|---|---|---|---|
| 环境因子 Environmental factor | -0.201 (p > 0.05) | 总计 Summed | 0.042 (p > 0.05) | -0.159 (p > 0.05) |
| 通过均匀度指数 Via EI | -0.093 (p > 0.05) | |||
| 通过树冠结构复杂性 Via CSC | -0.001 (p > 0.05) | |||
| 通过林分胸高断面积 Via SBA | 0.137 (p= 0.021) | |||
| 均匀度指数 EI | 0.284 (p= 0.006) | 总计 Summed | -0.077 (p > 0.05) | 0.207 (p= 0.036) |
| 通过树冠结构复杂性 Via CSC | 0.082 (p > 0.05) | |||
| 通过林分胸高断面积 Via SBA | -0.158 (p= 0.008) | |||
| 树冠结构复杂性CSC | 0.229 (p= 0.045) | 总计 Summed | 0.227 (p= 0.004) | 0.455 (p< 0.001) |
| 通过林分胸高断面积 Via SBA | 0.227 (p= 0.004) | |||
| 林分胸高断面积 SBA | 0.379 (p= 0.002) | 0.379 (p= 0.002) |
| 预测因子 Predictor | 直接效应 Direct effect | 间接效应途径 Pathways of indirect effect | 间接效应 Indirect effect | 总效应 Total effect |
|---|---|---|---|---|
| 环境因子 Environmental factor | 0.177 (p > 0.05) | 总计 Summed | 0.064 (p > 0.05) | -0.146 (p > 0.05) |
| 通过均匀度指数 Via EI | -0.080 (p > 0.05) | |||
| 通过树冠垂直分层 Via CVS | 0.036 (p > 0.05) | |||
| 通过林分胸高断面积 Via SBA | 0.137 (p= 0.021) | |||
| 均匀度指数 EI | 0.244 (p= 0.007) | 总计 Summed | -0.067 (p > 0.05) | 0.263 (p= 0.006) |
| 通过树冠垂直分层 Via CVS | 0.020 (p > 0.05) | |||
| 通过林分胸高断面积 Via SBA | 0.086 (p > 0.05) | |||
| 树冠垂直分层 CVS | 0.434 (p< 0.001) | 总计 Summed | 0.126 (p > 0.05) | 0.560 (p< 0.001) |
| 通过林分胸高断面积 Via SBA | 0.126 (p > 0.05) | |||
| 林分胸高断面积 SBA | 0.208 (p > 0.05) | 0.208 (p > 0.05) |
表5 均匀度指数、树冠垂直分层、林分胸高断面积和环境因素对典型阔叶红松林生产力的直接、间接和总效应
Table 5 Direct, indirect, and total standardized effects of evenness index (EI), canopy vertical stratification (CVS), stand basal area (SBA) and environmental factor on productivity in a typical mixed broadleaved-Korean pine forest
| 预测因子 Predictor | 直接效应 Direct effect | 间接效应途径 Pathways of indirect effect | 间接效应 Indirect effect | 总效应 Total effect |
|---|---|---|---|---|
| 环境因子 Environmental factor | 0.177 (p > 0.05) | 总计 Summed | 0.064 (p > 0.05) | -0.146 (p > 0.05) |
| 通过均匀度指数 Via EI | -0.080 (p > 0.05) | |||
| 通过树冠垂直分层 Via CVS | 0.036 (p > 0.05) | |||
| 通过林分胸高断面积 Via SBA | 0.137 (p= 0.021) | |||
| 均匀度指数 EI | 0.244 (p= 0.007) | 总计 Summed | -0.067 (p > 0.05) | 0.263 (p= 0.006) |
| 通过树冠垂直分层 Via CVS | 0.020 (p > 0.05) | |||
| 通过林分胸高断面积 Via SBA | 0.086 (p > 0.05) | |||
| 树冠垂直分层 CVS | 0.434 (p< 0.001) | 总计 Summed | 0.126 (p > 0.05) | 0.560 (p< 0.001) |
| 通过林分胸高断面积 Via SBA | 0.126 (p > 0.05) | |||
| 林分胸高断面积 SBA | 0.208 (p > 0.05) | 0.208 (p > 0.05) |
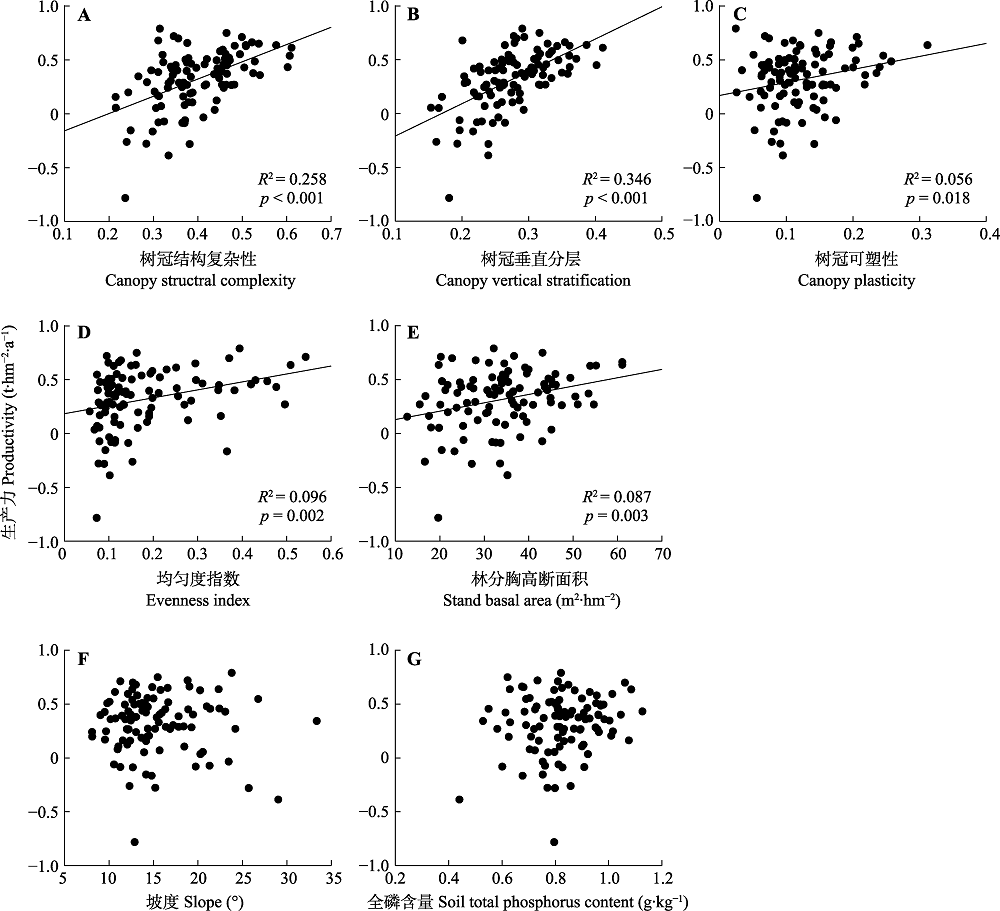
图4 典型阔叶红松林生产力(对数转换值)与各个解释变量的双变量关系。p < 0.05表示拟合关系显著; p > 0.05时拟合关系不显著, 无回归直线。
Fig. 4 Bivariate relationships between productivity (ln transformed) and explanatory variables in a typical mixed broadleaved- Korean pine forest. Fitted regression is significant at p < 0.05 and the relationships without fitted lines are insignificant at p > 0.05.
| 预测因子 Predictor | 直接效应 Direct effect | 间接效应途径 Pathways of indirect effect | 间接效应 Indirect effect | 总效应 Total effect |
|---|---|---|---|---|
| 环境因子 Environmental factor | -0.264 (p= 0.024) | 总计 Summed | 0.073 (p > 0.05) | -0.191 (p > 0.05) |
| 通过均匀度指数 Via EI | -0.136 (p= 0.011) | |||
| 通过树冠可塑性 Via CP | 0.004 (p > 0.05) | |||
| 通过林分胸高断面积 Via SBA | 0.205 (p= 0.006) | |||
| 均匀度指数 EI | 0.417 (p< 0.001) | 总计 Summed | -0.195 (p= 0.014) | 0.222 (p= 0.030) |
| 通过树冠可塑性 Via CP | -0.017 (p > 0.05) | |||
| 通过林分胸高断面积 Via SBA | -0.178 (p= 0.005) | |||
| 树冠可塑性CP | -0.045 (p > 0.05) | 总计 Summed | 0.171 (p= 0.005) | 0.126 (p > 0.05) |
| 通过林分胸高断面积 Via SBA | 0.171 (p= 0.005) | |||
| 林分胸高断面积 SBA | 0.544 (p < 0.001) | 0.544 (p < 0.001) |
表6 均匀度指数、树冠可塑性、林分胸高断面积和环境因素对典型阔叶红松林生产力的直接、间接和总效应
Table 6 Direct, indirect, and total standardized effects of evenness index (EI), canopy plasticity (CP), stand basal area (SBA) and environmental factors on productivity in a typical mixed broadleaved-Korean pine forest
| 预测因子 Predictor | 直接效应 Direct effect | 间接效应途径 Pathways of indirect effect | 间接效应 Indirect effect | 总效应 Total effect |
|---|---|---|---|---|
| 环境因子 Environmental factor | -0.264 (p= 0.024) | 总计 Summed | 0.073 (p > 0.05) | -0.191 (p > 0.05) |
| 通过均匀度指数 Via EI | -0.136 (p= 0.011) | |||
| 通过树冠可塑性 Via CP | 0.004 (p > 0.05) | |||
| 通过林分胸高断面积 Via SBA | 0.205 (p= 0.006) | |||
| 均匀度指数 EI | 0.417 (p< 0.001) | 总计 Summed | -0.195 (p= 0.014) | 0.222 (p= 0.030) |
| 通过树冠可塑性 Via CP | -0.017 (p > 0.05) | |||
| 通过林分胸高断面积 Via SBA | -0.178 (p= 0.005) | |||
| 树冠可塑性CP | -0.045 (p > 0.05) | 总计 Summed | 0.171 (p= 0.005) | 0.126 (p > 0.05) |
| 通过林分胸高断面积 Via SBA | 0.171 (p= 0.005) | |||
| 林分胸高断面积 SBA | 0.544 (p < 0.001) | 0.544 (p < 0.001) |
| [1] |
Ali A, Lin SL, He JK, Kong FM, Yu JH, Jiang HS (2019). Tree crown complementarity links positive functional diversity and aboveground biomass along large-scale ecological gradients in tropical forests. Science of the Total Environment, 656,45-54.
DOI URL |
| [2] |
Ali A, Yan ER, Chen HYH, Chang SX, Zhao YT, Yang XD, Xu MS (2016). Stand structural diversity rather than species diversity enhances aboveground carbon storage in secondary subtropical forests in Eastern China. Biogeosciences, 13,4627-4635.
DOI URL |
| [3] |
Bartoń K (2016). Multi-model inference. Sociological Methods and Research, 33,261-304.
DOI URL |
| [4] | Bayer D, Seifert S, Pretzsch H (2013). Structural crown properties of Norway spruce (Picea abies L. Karst.) and European beech (Fagus sylvatica L.) in mixed versus pure stands revealed by terrestrial laser scanning. Trees, 27, 1035- 1047. |
| [5] |
Bohn FJ, Huth A (2017). The importance of forest structure to biodiversity-productivity relationships. Royal Society Open Science, 4,160521. DOI: 10.1098/rsos.160521.
DOI URL |
| [6] |
Chave J, Condit R, Lao S, Caspersen JP, Foster RB, Hubbell SP (2003). Spatial and temporal variation of biomass in a tropical forest: results from a large census plot in Panama. Journal of Ecology, 91,240-252.
DOI URL |
| [7] | Chen CG, Zhu JF (1989). A Handbook for Main Tree Species Biomass in Northeast China. China Forestry Press, Beijing. |
| [ 陈传国, 朱俊凤 (1989). 东北主要林木生物量手册. 中国林业出版社, 北京.] | |
| [8] |
Dănescu A, Albrecht AT, Bauhus J (2016). Structural diversity promotes productivity of mixed, uneven-aged forests in southwestern Germany. Oecologia, 182,319-333.
DOI PMID |
| [9] |
Fahey RT, Fotis AT, Woods KD (2015). Quantifying canopy complexity and effects on productivity and resilience in late-successional hemlock-hardwood forests. Ecological Applications, 25,834-847.
DOI URL |
| [10] |
Forrester DI (2014). The spatial and temporal dynamics of species interactions in mixed-species forests: from pattern to process. Forest Ecology and Management, 312,282-292.
DOI URL |
| [11] | Fotis AT, Morin TH, Fahey RT, Hardiman BS, Bohrer G, Curtis PS (2018). Forest structure in space and time: biotic and abiotic determinants of canopy complexity and their effects on net primary productivity. Agricultural and Forest Meteorology, 250-251,181-191. |
| [12] |
Grace JB, Anderson TM, Seabloom EW, Borer ET, Adler PB, Harpole WS, Hautier Y, Hillebrand H, Lind EM, Pärtel M, Bakker JD, Buckley YM, Crawley MJ, Damschen EI, Davies KF, et al. (2016). Integrative modelling reveals mechanisms linking productivity and plant species richness. Nature, 529,390-393.
DOI URL |
| [13] |
Guo YL, Wang B, Xiang WS, Ding T, Lu SH, Huang FZ, Wen SJ, Li DX, He YL, Li XK (2016). Responses of spatial pattern of woody plants’ basal area to topographic factors in a tropical karst seasonal rainforest in Nonggang, Guangxi, southern China. Biodiversity Science, 24,30-39.
DOI URL PMID |
|
[ 郭屹立, 王斌, 向悟生, 丁涛, 陆树华, 黄甫昭, 文淑均, 李冬兴, 何运林, 李先琨 (2016). 喀斯特季节性雨林木本植物胸高断面积分布格局及其对地形因子的响应. 生物多样性, 24,30-39.]
DOI PMID |
|
| [14] |
Hardiman BS, Gough CM, Halperin A, Hofmeister KL, Nave LE, Bohrer G, Curtis PS (2013). Maintaining high rates of carbon storage in old forests: a mechanism linking canopy structure to forest function. Forest Ecology and Management, 298,111-119.
DOI URL |
| [15] |
Hillebrand H, Bennett DM, Cadotte MW (2008). Consequences of dominance: a review of evenness effects on local and regional ecosystem processes. Ecology, 89,1510-1520.
PMID |
| [16] | Howard AL (2013). Handbook of structural equation modeling. Structural Equation Modeling: a Multidisciplinary Journal, 20,354-360. |
| [17] |
Jucker T, Bouriaud O, Coomes DA (2015). Crown plasticity enables trees to optimize canopy packing in mixed-species forests. Functional Ecology, 29,1078-1086.
DOI URL |
| [18] | Klute A (1986). Methods of Soil Analysis: Part 1—Physical and Mineralogical Methods. 2nd ed. American Society of Agronomy, Soil Science Society of America, Madison, USA. |
| [19] |
Legendre P, Mi XC, Ren HB, Ma KP, Yu MJ, Sun IF, He FL (2009). Partitioning beta diversity in a subtropical broad- leaved forest of China. Ecology, 90,663-674.
PMID |
| [20] |
Liang J, Crowther TW, Picard N, Wiser S, Zhou M, Alberti G, Schulze E-D, David McGuire A, Bozzato F, Pretzsch H, de Miguel S, Paquette A, Hérault B, Scherer-Lorenzen M, Barrett CB, et al. (2016). Positive biodiversity-productivity relationship predominant in global forests. Science, 354,aaf8957. DOI: 10.1126/science.aaf8957.
DOI URL |
| [21] |
Lin F, Comita LS, Wang XG, Bai XJ, Yuan ZQ, Xing DL, Hao ZQ (2014). The contribution of understory light availability and biotic neighborhood to seedling survival in secondary versus old-growth temperate forest. Plant Ecology, 215,795-807.
DOI URL |
| [22] |
Muth CC, Bazzaz FA (2003). Tree canopy displacement and neighborhood interactions. Canadian Journal of Forest Research, 33,1323-1330.
DOI URL |
| [23] |
Pretzsch H (2014). Canopy space filling and tree crown morphology in mixed-species stands compared with monocultures. Forest Ecology and Management, 327,251-264.
DOI URL |
| [24] |
Purves DW, Lichstein JW, Pacala SW (2007). Crown plasticity and competition for canopy space: a new spatially implicit model parameterized for 250 North American tree species. PLOS ONE, 2,e870. DOI: 10.1371/journal.pone.0000870.
DOI URL |
| [25] |
Quesada CA, Phillips OL, Schwarz M, Czimczik CI, Baker TR, Patiño S, Fyllas NM, Hodnett MG, Herrera R, Almeida S, Alvarez Dávila E, Arneth A, Arroyo L, Chao KJ, Dezzeo N, et al. (2012). Basin-wide variations in Amazon forest structure and function are mediated by both soils and climate. Biogeosciences, 9,2203-2246.
DOI URL |
| [26] |
Rissanen K, Martin-Guay MO, Riopel-Bouvier AS, Paquette A (2019). Light interception in experimental forests affected by tree diversity and structural complexity of dominant canopy. Agricultural and Forest Meteorology, 278,107655. DOI: 10.1016/j.agrformet.2019.107655.
DOI URL |
| [27] |
Rosseel Y (2012). lavaan: an R package for structural equation modeling. Journal of Statistical Software, 48,2. DOI: 10.18637/jss.v048.i02.
DOI |
| [28] |
Sapijanskas J, Paquette A, Potvin C, Kunert N, Loreau M (2014). Tropical tree diversity enhances light capture through crown plasticity and spatial and temporal niche differences. Ecology, 95,2479-2492.
DOI URL |
| [29] |
Seidel D, Leuschner C, Müller A, Krause B (2011). Crown plasticity in mixed forests—Quantifying asymmetry as a measure of competition using terrestrial laser scanning. Forest Ecology and Management, 261,2123-2132.
DOI URL |
| [30] |
Sterba H, Dirnberger G, Ritter T (2019). Vertical distribution of leaf area of European larch (Larix decidua Mill.) and Norway spruce (Picea abies L. Karst.) in pure and mixed stand. Forests, 10,570. DOI: 10.3390/f10070570.
DOI URL |
| [31] |
Toïgo M, Perot T, Courbaud B, Castagneyrol B, Gégout JC, Longuetaud F, Jactel H, Vallet P (2018). Difference in shade tolerance drives the mixture effect on oak productivity. Journal of Ecology, 106,1073-1082.
DOI URL |
| [32] |
Vockenhuber EA, Scherber C, Langenbruch C, Meißner M, Seidel D, Tscharntke T (2011). Tree diversity and environmental context predict herb species richness and cover in Germanyʼs largest connected deciduous forest. Perspectives in Plant Ecology, Evolution and Systematics, 13,111-119.
DOI URL |
| [33] | Wang YQ (1995). The Mixed Broadleaved-Korean Pine Forest. Northeast Forestry University Press, Harbin. |
| [ 王业蘧 (1995). 阔叶红松林. 东北林业大学出版社, 哈尔滨.] | |
| [34] | Wen PY, Jin GZ (2019). Effects of topography on species diversity in a typical mixed broadleaved-Korean pine forest. Acta Ecologica Sinica, 39,945-956. |
| [ 温佩颖, 金光泽 (2019). 地形对阔叶红松林物种多样性的影响. 生态学报, 39,945-956.] | |
| [35] |
Williams LJ, Paquette A, Cavender-Bares J, Messier C, Reich PB (2017). Spatial complementarity in tree crowns explains overyielding in species mixtures. Nature Ecology & Evolution, 1,0063. DOI: 10.1038/s41559-016-0063.
DOI |
| [36] |
Xu LN, Jin GZ (2012). Species composition and community structure of a typical mixed broadleaved-Korean pine (Pinus koraiensis) forest plot in Liangshui Nature Reserve, Northeast China. Biodiversity Science, 20,470-481.
DOI URL PMID |
|
[ 徐丽娜, 金光泽 (2012). 小兴安岭凉水典型阔叶红松林动态监测样地: 物种组成与群落结构. 生物多样性, 20,470-481.]
DOI PMID |
|
| [37] |
Yuan Z, Ali A, Wang S, Gazol A, Freckleton R, Wang X, Lin F, Ye J, Zhou L, Hao Z, Loreau M (2018). Abiotic and biotic determinants of coarse woody productivity in temperate mixed forests. Science of the Total Environment, 630,422-431.
DOI URL |
| [38] |
Zeller L, Liang J, Pretzsch H (2018). Tree species richness enhances stand productivity while stand structure can have opposite effects, based on forest inventory data from Germany and the United States of America. Forest Ecosystems, 5,4. DOI: 10.1186/s40663-017-0127-6.
DOI URL |
| [39] |
Zhang Y, Chen HYH, Reich PB (2012). Forest productivity increases with evenness, species richness and trait variation: a global meta-analysis. Journal of Ecology, 100,742-749.
DOI URL |
| [40] |
Zheng LT, Chen HYH, Yan ER (2019). Tree species diversity promotes litterfall productivity through crown complementarity in subtropical forests. Journal of Ecology, 107,1852-1861.
DOI URL |
| [41] |
Zhu Y, Cai HY, Jiang F, Jin GZ (2017). Variation of the biotic neighbourhood and topographic effects on tree survival in an old-growth temperate forest. Journal of Vegetation Science, 28,1166-1177.
DOI URL |
| [1] | 白皓然 侯盟 刘艳杰. 少花蒺藜草入侵与干旱对羊草草原生产力的影响机制[J]. 植物生态学报, 2024, 48(5): 577-589. |
| [2] | 杨宇萌, 来全, 刘心怡. 气候变化和人类活动对内蒙古植被总初级生产力的定量影响[J]. 植物生态学报, 2024, 48(3): 306-316. |
| [3] | 张中扬, 宋希强, 任明迅, 张哲. 附生维管植物生境营建作用的生态学功能[J]. 植物生态学报, 2023, 47(7): 895-911. |
| [4] | 杨佳绒, 戴冬, 陈俊芳, 吴宪, 刘啸林, 刘宇. 丛枝菌根真菌多样性对植物群落构建和稀有种维持的研究进展[J]. 植物生态学报, 2023, 47(6): 745-755. |
| [5] | 张琦, 冯可, 常智慧, 何双辉, 徐维启. 灌丛化对林草交错带植物和土壤微生物的影响[J]. 植物生态学报, 2023, 47(6): 770-781. |
| [6] | 李伟, 张荣. 亚高寒草甸群落结构决定群落生产力实例验证[J]. 植物生态学报, 2023, 47(5): 713-723. |
| [7] | 冯可, 刘冬梅, 张琦, 安菁, 何双辉. 旅游干扰对松山油松林土壤微生物多样性及群落结构的影响[J]. 植物生态学报, 2023, 47(4): 584-596. |
| [8] | 李耀琪, 王志恒. 植物功能生物地理学的研究进展与展望[J]. 植物生态学报, 2023, 47(2): 145-169. |
| [9] | 杨元合, 张典业, 魏斌, 刘洋, 冯雪徽, 毛超, 徐玮婕, 贺美, 王璐, 郑志虎, 王媛媛, 陈蕾伊, 彭云峰. 草地群落多样性和生态系统碳氮循环对氮输入的非线性响应及其机制[J]. 植物生态学报, 2023, 47(1): 1-24. |
| [10] | 刘沛荣, 同小娟, 孟平, 张劲松, 张静茹, 于裴洋, 周宇. 散射辐射对中国东部典型人工林总初级生产力的影响[J]. 植物生态学报, 2022, 46(8): 904-918. |
| [11] | 魏龙鑫, 耿燕, 崔可达, 乔雪涛, 岳庆敏, 范春雨, 张春雨, 赵秀海. 阔叶红松林不同林层和生长阶段树木生长对采伐强度的响应[J]. 植物生态学报, 2022, 46(6): 642-655. |
| [12] | 马和平, 王瑞红, 屈兴乐, 袁敏, 慕金勇, 李金航. 不同生境对藏东南地面生苔藓多样性和生物量的影响[J]. 植物生态学报, 2022, 46(5): 552-560. |
| [13] | 原媛, 母艳梅, 邓钰洁, 李鑫豪, 姜晓燕, 高圣杰, 查天山, 贾昕. 植被覆盖度和物候变化对典型黑沙蒿灌丛生态系统总初级生产力的影响[J]. 植物生态学报, 2022, 46(2): 162-175. |
| [14] | 张义, 程杰, 苏纪帅, 程积民. 长期封育演替下典型草原植物群落生产力与多样性关系[J]. 植物生态学报, 2022, 46(2): 176-187. |
| [15] | 韩聪, 刘鹏, 母艳梅, 原媛, 郝少荣, 田赟, 查天山, 贾昕. 黑沙蒿灌丛生态系统碳平衡对昼夜非对称增温的响应[J]. 植物生态学报, 2022, 46(12): 1473-1485. |
| 阅读次数 | ||||||
|
全文 |
|
|||||
|
摘要 |
|
|||||
Copyright © 2026 版权所有 《植物生态学报》编辑部
地址: 北京香山南辛村20号, 邮编: 100093
Tel.: 010-62836134, 62836138; Fax: 010-82599431; E-mail: apes@ibcas.ac.cn, cjpe@ibcas.ac.cn
备案号: 京ICP备16067583号-19
![]()