
植物生态学报 ›› 2020, Vol. 44 ›› Issue (7): 763-771.DOI: 10.17521/cjpe.2019.0162 cstr: 32100.14.cjpe.2019.0162
邢磊1,2, 段娜3, 李清河1,2,*( ), 刘成功1,2, 李慧卿1,2, 孙高洁1,2
收稿日期:2019-06-26
接受日期:2020-05-01
出版日期:2020-07-20
发布日期:2020-07-03
基金资助:
XING Lei1,2, DUAN Na3, LI Qing-He1,2,*(), LIU Cheng-Gong1,2, LI Hui-Qing1,2, SUN Gao-Jie1,2
Received:2019-06-26
Accepted:2020-05-01
Online:2020-07-20
Published:2020-07-03
Supported by:摘要:
植物生物量的分配模式是植物对环境适应的结果, 并伴随着植物生活史的每一个阶段, 与植物的生长和发育息息相关。目前关于植物生物量分配的大小依赖性已有相关报道, 但关于其对物候期的响应尚鲜有报道。该研究以乌兰布和沙漠地区白刺(Nitraria tangutorum)为研究对象, 通过对其2016与2017年连续2个生长季里盛花期、盛果期与营养生长期3个物候期的根、压条、新枝、老枝、叶、繁殖器官等部分的生物量测定, 采用标准化主轴回归方程的斜率和截距的显著性比较, 分别探讨了白刺在不同物候期的异速生长的大小依赖程度和相对生物量分配比例, 特别是地上与地下部分之间、支持与同化器官之间, 在不同物候期的生物量分配规律。结果表明: 白刺的繁殖生长对生物量分配模式造成的影响主要体现在相对生物量分配比例(36.00%)而不是个体大小的依赖性程度上(16.67%), 且对新枝的影响较大, 使其不同物候期的大小依赖性程度发生了改变, 但是变化趋势不一致, 同时繁殖生长增加对叶片的相对生物量分配比例, 减少对老枝的相对生物量分配比例, 但并没有改变他们的大小依赖性程度。白刺生长过程中的地下部分生物量分配率随个体生物量的累积均增大, 而繁殖分配会在一定程度内减弱这种速率。白刺随着个体生物量的增大其生物量向支持器官分配率也越大, 但随着生长时间推移, 更倾向于将生物量分配给同化吸收器官。
邢磊, 段娜, 李清河, 刘成功, 李慧卿, 孙高洁. 白刺不同物候期的生物量分配规律. 植物生态学报, 2020, 44(7): 763-771. DOI: 10.17521/cjpe.2019.0162
XING Lei, DUAN Na, LI Qing-He, LIU Cheng-Gong, LI Hui-Qing, SUN Gao-Jie. Variation in biomass allocation of Nitraria tangutorum during different phenological phases. Chinese Journal of Plant Ecology, 2020, 44(7): 763-771. DOI: 10.17521/cjpe.2019.0162
| 时期 Time | 样本数 N | R | Le | S | B | La | F | T | ||||||||
|---|---|---|---|---|---|---|---|---|---|---|---|---|---|---|---|---|
| M | SD | M | SD | M | SD | M | SD | M | SD | M | SD | M | SD | |||
| 2016 | 5月 May | 45 | 3.726 | 3.026 | 4.138 | 3.256 | 0.686 | 0.574 | 8.847 | 6.28 | 6.274 | 4.691 | 0.575 | 0.948 | 24.248 | 15.255 |
| 7月 July | 213 | 4.351 | 4.232 | 6.182 | 6.549 | 2.498 | 3.18 | 12.506 | 9.714 | 10.284 | 9.866 | 1.593 | 2.018 | 37.415 | 26.952 | |
| 9月 Sept. | 47 | 2.217 | 1.746 | 8.877 | 9.514 | 8.618 | 10.456 | 17.173 | 16.67 | 8.670 | 6.188 | - | - | 50.640 | 44.827 | |
| 2017 | 5月 May | 112 | 7.417 | 5.936 | 7.738 | 8.726 | 2.309 | 3.237 | 22.260 | 27.997 | 25.045 | 26.766 | 1.048 | 1.370 | 65.817 | 65.777 |
| 7月 July | 100 | 10.334 | 9.637 | 12.198 | 10.636 | 7.098 | 6.978 | 23.631 | 20.556 | 37.957 | 24.793 | 3.078 | 6.407 | 94.296 | 70.004 | |
| 9月 Sept. | 95 | 10.008 | 6.787 | 7.316 | 9.089 | 9.963 | 14.905 | 35.305 | 26.269 | 33.716 | 22.517 | - | - | 96.308 | 80.532 | |
表1 白刺各时期样本量及各器官平均生物量
Table 1 Sample size and average biomass of each organ in six stages of Nitraria tangutorum
| 时期 Time | 样本数 N | R | Le | S | B | La | F | T | ||||||||
|---|---|---|---|---|---|---|---|---|---|---|---|---|---|---|---|---|
| M | SD | M | SD | M | SD | M | SD | M | SD | M | SD | M | SD | |||
| 2016 | 5月 May | 45 | 3.726 | 3.026 | 4.138 | 3.256 | 0.686 | 0.574 | 8.847 | 6.28 | 6.274 | 4.691 | 0.575 | 0.948 | 24.248 | 15.255 |
| 7月 July | 213 | 4.351 | 4.232 | 6.182 | 6.549 | 2.498 | 3.18 | 12.506 | 9.714 | 10.284 | 9.866 | 1.593 | 2.018 | 37.415 | 26.952 | |
| 9月 Sept. | 47 | 2.217 | 1.746 | 8.877 | 9.514 | 8.618 | 10.456 | 17.173 | 16.67 | 8.670 | 6.188 | - | - | 50.640 | 44.827 | |
| 2017 | 5月 May | 112 | 7.417 | 5.936 | 7.738 | 8.726 | 2.309 | 3.237 | 22.260 | 27.997 | 25.045 | 26.766 | 1.048 | 1.370 | 65.817 | 65.777 |
| 7月 July | 100 | 10.334 | 9.637 | 12.198 | 10.636 | 7.098 | 6.978 | 23.631 | 20.556 | 37.957 | 24.793 | 3.078 | 6.407 | 94.296 | 70.004 | |
| 9月 Sept. | 95 | 10.008 | 6.787 | 7.316 | 9.089 | 9.963 | 14.905 | 35.305 | 26.269 | 33.716 | 22.517 | - | - | 96.308 | 80.532 | |
| 器官 Organ | 时期 Time | 2016 | 2017 | ||||||||||||||
|---|---|---|---|---|---|---|---|---|---|---|---|---|---|---|---|---|---|
| 截距及置信区间 Intercept (95% CI) | 斜率及置信区间 Slope (95% CI) | r2 | p | 截距及置信区间 Intercept (95% CI) | 斜率及置信区间 Slope (95% CI) | r2 | p | ||||||||||
| R/T | 5月 May | -1.226 5 | -1.476 6 | -0.976 3 | 1.280 0 | 1.106 9 | 1.480 2 | 0.775 2 | 0.000 0 | -0.601 6 | -0.791 4 | -0.411 8 | 0.823 8 | 0.719 7 | 0.942 8 | 0.486 4 | 0.000 0 |
| 7月 July | -1.576 5 | -1.770 5 | -1.382 4 | 1.379 3 | 1.256 6 | 1.513 8 | 0.528 1 | 0.000 0 | -1.080 8 | -1.350 7 | -0.810 8 | 1.052 9 | 0.919 6 | 1.205 5 | 0.541 4 | 0.000 0 | |
| 9月 Sept. | -1.213 2 | -1.461 2 | -0.965 3 | 1.200 2 | 1.055 7 | 1.364 5 | 0.816 5 | 0.000 0 | -0.719 0 | -0.953 0 | -0.485 1 | 0.875 3 | 0.760 3 | 1.007 7 | 0.529 0 | 0.000 0 | |
| Le/T | 5月 May | -1.313 1 | -1.613 4 | -1.012 7 | 1.373 4 | 1.167 5 | 1.615 6 | 0.718 7 | 0.000 0 | -1.520 7 | -1.699 2 | -1.342 3 | 1.303 6 | 1.202 6 | 1.413 1 | 0.817 5 | 0.000 0 |
| 7月 July | -1.359 6 | -1.514 9 | -1.204 2 | 1.335 1 | 1.236 0 | 1.442 2 | 0.676 4 | 0.000 0 | -1.624 6 | -1.826 1 | -1.423 1 | 1.354 2 | 1.251 6 | 1.465 3 | 0.845 0 | 0.000 0 | |
| 9月 Sept. | -1.171 0 | -1.394 9 | -0.947 1 | 1.222 4 | 1.090 8 | 1.369 7 | 0.855 6 | 0.000 0 | -1.684 3 | -1.969 7 | -1.398 9 | 1.253 3 | 1.111 3 | 1.413 3 | 0.657 7 | 0.000 0 | |
| S/T | 5月 May | -2.529 4 | -3.053 9 | -2.005 0 | 1.680 9 | 1.335 3 | 2.116 1 | 0.429 8 | 0.000 0 | -2.762 3 | -3.048 4 | -2.476 2 | 1.655 0 | 1.495 0 | 1.832 2 | 0.709 5 | 0.000 0 |
| 7月 July | -2.424 0 | -2.666 1 | -2.181 8 | 1.720 7 | 1.567 7 | 1.888 6 | 0.527 9 | 0.000 0 | -2.016 4 | -2.279 6 | -1.753 1 | 1.421 7 | 1.289 0 | 1.568 1 | 0.760 1 | 0.000 0 | |
| 9月 Sept. | -1.406 8 | -1.737 6 | -1.076 1 | 1.336 0 | 1.145 9 | 1.557 5 | 0.736 7 | 0.000 0 | -2.929 8 | -3.352 1 | -2.507 6 | 1.902 3 | 1.692 0 | 2.138 8 | 0.674 7 | 0.000 0 | |
| B/T | 5月 May | -0.829 4 | -1.114 9 | -0.543 8 | 1.272 9 | 1.077 6 | 1.503 6 | 0.704 0 | 0.000 0 | -0.970 3 | -1.157 9 | -0.782 7 | 1.254 0 | 1.148 3 | 1.369 5 | 0.782 2 | 0.000 0 |
| 7月 July | -0.841 9 | -1.017 0 | -0.666 7 | 1.228 4 | 1.118 3 | 1.349 4 | 0.531 1 | 0.000 0 | -0.934 7 | -1.176 9 | -0.692 4 | 1.157 7 | 1.036 4 | 1.293 2 | 0.693 9 | 0.000 0 | |
| 9月 Sept. | -0.820 6 | -1.060 8 | -0.580 5 | 1.198 1 | 1.057 9 | 1.356 9 | 0.827 2 | 0.000 0 | -0.797 0 | -1.006 5 | -0.587 5 | 1.167 1 | 1.061 4 | 1.283 3 | 0.787 0 | 0.000 0 | |
| La/T | 5月 May | -0.949 8 | -1.355 6 | -0.544 0 | 1.251 7 | 0.985 7 | 1.589 5 | 0.385 0 | 0.000 0 | -0.681 4 | -0.817 8 | -0.545 0 | 1.137 8 | 1.060 2 | 1.221 1 | 0.859 9 | 0.000 0 |
| 7月 July | -1.071 1 | -1.260 4 | -0.881 8 | 1.305 1 | 1.185 7 | 1.436 5 | 0.498 7 | 0.000 0 | -0.522 1 | -0.688 6 | -0.355 6 | 1.061 3 | 0.976 6 | 1.153 3 | 0.827 7 | 0.000 0 | |
| 9月 Sept. | -0.602 8 | -0.955 4 | -0.250 2 | 0.915 6 | 0.722 7 | 1.160 0 | 0.367 4 | 0.000 0 | -0.614 8 | -0.811 5 | -0.418 1 | 1.081 9 | 0.982 7 | 1.191 0 | 0.781 5 | 0.000 0 | |
| F/T | 5月 May | -4.740 7 | -5.773 3 | -3.708 0 | 2.994 2 | 2.323 4 | 3.858 7 | 0.305 1 | 0.000 1 | -2.925 5 | -3.413 8 | -2.437 2 | 1.608 8 | 1.354 5 | 1.910 8 | 0.333 8 | 0.000 0 |
| 7月 July | -2.630 6 | -2.949 3 | -2.311 8 | 1.749 9 | 1.558 1 | 1.965 3 | 0.381 2 | 0.000 0 | -4.587 9 | -5.612 5 | -3.563 2 | 2.455 7 | 2.008 1 | 3.003 1 | 0.470 1 | 0.000 0 | |
| 9月 Sept. | - | - | - | - | - | - | - | - | - | - | - | - | - | - | - | - | |
表2 2016与2017年白刺不同物候期各器官与整株生物量的标准化主轴回归方程
Table 2 Standardized-major-axis results of biomass between organs and whole plant of Nitraria tangutorum of different phenological periods in 2016 and 2017
| 器官 Organ | 时期 Time | 2016 | 2017 | ||||||||||||||
|---|---|---|---|---|---|---|---|---|---|---|---|---|---|---|---|---|---|
| 截距及置信区间 Intercept (95% CI) | 斜率及置信区间 Slope (95% CI) | r2 | p | 截距及置信区间 Intercept (95% CI) | 斜率及置信区间 Slope (95% CI) | r2 | p | ||||||||||
| R/T | 5月 May | -1.226 5 | -1.476 6 | -0.976 3 | 1.280 0 | 1.106 9 | 1.480 2 | 0.775 2 | 0.000 0 | -0.601 6 | -0.791 4 | -0.411 8 | 0.823 8 | 0.719 7 | 0.942 8 | 0.486 4 | 0.000 0 |
| 7月 July | -1.576 5 | -1.770 5 | -1.382 4 | 1.379 3 | 1.256 6 | 1.513 8 | 0.528 1 | 0.000 0 | -1.080 8 | -1.350 7 | -0.810 8 | 1.052 9 | 0.919 6 | 1.205 5 | 0.541 4 | 0.000 0 | |
| 9月 Sept. | -1.213 2 | -1.461 2 | -0.965 3 | 1.200 2 | 1.055 7 | 1.364 5 | 0.816 5 | 0.000 0 | -0.719 0 | -0.953 0 | -0.485 1 | 0.875 3 | 0.760 3 | 1.007 7 | 0.529 0 | 0.000 0 | |
| Le/T | 5月 May | -1.313 1 | -1.613 4 | -1.012 7 | 1.373 4 | 1.167 5 | 1.615 6 | 0.718 7 | 0.000 0 | -1.520 7 | -1.699 2 | -1.342 3 | 1.303 6 | 1.202 6 | 1.413 1 | 0.817 5 | 0.000 0 |
| 7月 July | -1.359 6 | -1.514 9 | -1.204 2 | 1.335 1 | 1.236 0 | 1.442 2 | 0.676 4 | 0.000 0 | -1.624 6 | -1.826 1 | -1.423 1 | 1.354 2 | 1.251 6 | 1.465 3 | 0.845 0 | 0.000 0 | |
| 9月 Sept. | -1.171 0 | -1.394 9 | -0.947 1 | 1.222 4 | 1.090 8 | 1.369 7 | 0.855 6 | 0.000 0 | -1.684 3 | -1.969 7 | -1.398 9 | 1.253 3 | 1.111 3 | 1.413 3 | 0.657 7 | 0.000 0 | |
| S/T | 5月 May | -2.529 4 | -3.053 9 | -2.005 0 | 1.680 9 | 1.335 3 | 2.116 1 | 0.429 8 | 0.000 0 | -2.762 3 | -3.048 4 | -2.476 2 | 1.655 0 | 1.495 0 | 1.832 2 | 0.709 5 | 0.000 0 |
| 7月 July | -2.424 0 | -2.666 1 | -2.181 8 | 1.720 7 | 1.567 7 | 1.888 6 | 0.527 9 | 0.000 0 | -2.016 4 | -2.279 6 | -1.753 1 | 1.421 7 | 1.289 0 | 1.568 1 | 0.760 1 | 0.000 0 | |
| 9月 Sept. | -1.406 8 | -1.737 6 | -1.076 1 | 1.336 0 | 1.145 9 | 1.557 5 | 0.736 7 | 0.000 0 | -2.929 8 | -3.352 1 | -2.507 6 | 1.902 3 | 1.692 0 | 2.138 8 | 0.674 7 | 0.000 0 | |
| B/T | 5月 May | -0.829 4 | -1.114 9 | -0.543 8 | 1.272 9 | 1.077 6 | 1.503 6 | 0.704 0 | 0.000 0 | -0.970 3 | -1.157 9 | -0.782 7 | 1.254 0 | 1.148 3 | 1.369 5 | 0.782 2 | 0.000 0 |
| 7月 July | -0.841 9 | -1.017 0 | -0.666 7 | 1.228 4 | 1.118 3 | 1.349 4 | 0.531 1 | 0.000 0 | -0.934 7 | -1.176 9 | -0.692 4 | 1.157 7 | 1.036 4 | 1.293 2 | 0.693 9 | 0.000 0 | |
| 9月 Sept. | -0.820 6 | -1.060 8 | -0.580 5 | 1.198 1 | 1.057 9 | 1.356 9 | 0.827 2 | 0.000 0 | -0.797 0 | -1.006 5 | -0.587 5 | 1.167 1 | 1.061 4 | 1.283 3 | 0.787 0 | 0.000 0 | |
| La/T | 5月 May | -0.949 8 | -1.355 6 | -0.544 0 | 1.251 7 | 0.985 7 | 1.589 5 | 0.385 0 | 0.000 0 | -0.681 4 | -0.817 8 | -0.545 0 | 1.137 8 | 1.060 2 | 1.221 1 | 0.859 9 | 0.000 0 |
| 7月 July | -1.071 1 | -1.260 4 | -0.881 8 | 1.305 1 | 1.185 7 | 1.436 5 | 0.498 7 | 0.000 0 | -0.522 1 | -0.688 6 | -0.355 6 | 1.061 3 | 0.976 6 | 1.153 3 | 0.827 7 | 0.000 0 | |
| 9月 Sept. | -0.602 8 | -0.955 4 | -0.250 2 | 0.915 6 | 0.722 7 | 1.160 0 | 0.367 4 | 0.000 0 | -0.614 8 | -0.811 5 | -0.418 1 | 1.081 9 | 0.982 7 | 1.191 0 | 0.781 5 | 0.000 0 | |
| F/T | 5月 May | -4.740 7 | -5.773 3 | -3.708 0 | 2.994 2 | 2.323 4 | 3.858 7 | 0.305 1 | 0.000 1 | -2.925 5 | -3.413 8 | -2.437 2 | 1.608 8 | 1.354 5 | 1.910 8 | 0.333 8 | 0.000 0 |
| 7月 July | -2.630 6 | -2.949 3 | -2.311 8 | 1.749 9 | 1.558 1 | 1.965 3 | 0.381 2 | 0.000 0 | -4.587 9 | -5.612 5 | -3.563 2 | 2.455 7 | 2.008 1 | 3.003 1 | 0.470 1 | 0.000 0 | |
| 9月 Sept. | - | - | - | - | - | - | - | - | - | - | - | - | - | - | - | - | |
| 器官 Organ | 2016 | 2017 | ||||
|---|---|---|---|---|---|---|
| df | LR | p | df | LR | p | |
| R/T | 2 | 3.104 | 0.211 8 | 2 | 6.844 | 0.032 7 |
| S/T | 2 | 7.665 | 0.021 7 | 2 | 14.02 | 0.000 9 |
| B/T | 2 | 0.339 6 | 0.843 8 | 2 | 1.716 | 0.424 1 |
| Le/T | 2 | 2.026 | 0.363 1 | 2 | 1.211 | 0.545 8 |
| La/T | 2 | 7.311 | 0.025 8 | 2 | 1.73 | 0.421 0 |
| F/T | 1 | 13.7 | 0.000 2 | 1 | 9.737 | 0.001 8 |
表3 白刺不同物候期各器官与整株标准化主轴回归斜率的似然比检验
Table 3 Likelihood ratio test of the slope of Standardized-major-axis of biomass between organs and whole plant of Nitraria tangutorum in three phenological phases
| 器官 Organ | 2016 | 2017 | ||||
|---|---|---|---|---|---|---|
| df | LR | p | df | LR | p | |
| R/T | 2 | 3.104 | 0.211 8 | 2 | 6.844 | 0.032 7 |
| S/T | 2 | 7.665 | 0.021 7 | 2 | 14.02 | 0.000 9 |
| B/T | 2 | 0.339 6 | 0.843 8 | 2 | 1.716 | 0.424 1 |
| Le/T | 2 | 2.026 | 0.363 1 | 2 | 1.211 | 0.545 8 |
| La/T | 2 | 7.311 | 0.025 8 | 2 | 1.73 | 0.421 0 |
| F/T | 1 | 13.7 | 0.000 2 | 1 | 9.737 | 0.001 8 |
| 2016 | 2017 | ||||||||
|---|---|---|---|---|---|---|---|---|---|
| 器官 Organ | 时期 Time | df | LR | p | 器官 Organ | 时期 Time | df | LR | p |
| S/T | 5月、7月 May vs. July | 1 | 0.098 1 | 0.851 9 | R/T | 5月、7月 May vs. July | 1 | 6.343 7 | 0.011 8 |
| 5月、9月 May vs. Sept. | 1 | 1.366 5 | 0.100 5 | 5月、9月 May vs. Sept. | 1 | 0.375 7 | 0.539 9 | ||
| 7月、9月 July vs. Sept. | 1 | 1.616 4 | 0.006 0 | 7月、9月 July vs. Sept. | 1 | 3.462 5 | 0.062 8 | ||
| La/T | 5月、7月 May vs. July | 1 | 0.103 6 | 0.747 6 | S/T | 5月、7月 May vs. July | 1 | 4.475 5 | 0.034 4 |
| 5月、9月 May vs. Sept. | 1 | 3.370 0 | 0.066 4 | 5月、9月 May vs. Sept. | 1 | 3.122 1 | 0.077 2 | ||
| 7月、9月 July vs. Sept. | 1 | 7.309 6 | 0.006 9 | 7月、9月 July vs. Sept. | 1 | 13.763 3 | 0.000 2 | ||
表4 白刺不同物候期之间部分器官与整株标准化主轴回归斜率的多重比较
Table 4 Multiple comparisons of slopes of Standardized-major-axis of biomass between partial organs and whole plant of Nitraria tangutorum in three phenological phases
| 2016 | 2017 | ||||||||
|---|---|---|---|---|---|---|---|---|---|
| 器官 Organ | 时期 Time | df | LR | p | 器官 Organ | 时期 Time | df | LR | p |
| S/T | 5月、7月 May vs. July | 1 | 0.098 1 | 0.851 9 | R/T | 5月、7月 May vs. July | 1 | 6.343 7 | 0.011 8 |
| 5月、9月 May vs. Sept. | 1 | 1.366 5 | 0.100 5 | 5月、9月 May vs. Sept. | 1 | 0.375 7 | 0.539 9 | ||
| 7月、9月 July vs. Sept. | 1 | 1.616 4 | 0.006 0 | 7月、9月 July vs. Sept. | 1 | 3.462 5 | 0.062 8 | ||
| La/T | 5月、7月 May vs. July | 1 | 0.103 6 | 0.747 6 | S/T | 5月、7月 May vs. July | 1 | 4.475 5 | 0.034 4 |
| 5月、9月 May vs. Sept. | 1 | 3.370 0 | 0.066 4 | 5月、9月 May vs. Sept. | 1 | 3.122 1 | 0.077 2 | ||
| 7月、9月 July vs. Sept. | 1 | 7.309 6 | 0.006 9 | 7月、9月 July vs. Sept. | 1 | 13.763 3 | 0.000 2 | ||
| 器官 Organ | 时期 Time | 2016 | 2017 | |||||
|---|---|---|---|---|---|---|---|---|
| df | LR | p | df | LR | p | |||
| R/T | 5月、7月 May vs. July | 1 | 0.099 3 | 0.752 7 | 1 | - | - | |
| 5月、9月 May vs. Sept. | 1 | 3.502 9 | 0.061 3 | 1 | 1.326 6 | 0.249 4 | ||
| 7月、9月 July vs. Sept. | 1 | 7.672 1 | 0.005 6 | 1 | 0.056 8 | 0.811 7 | ||
| S/T | 5月、7月 May vs. July | 1 | 0.821 5 | 0.364 8 | 1 | - | - | |
| 5月、9月 May vs. Sept. | 1 | 3.533 1 | 0.060 2 | 1 | 3.162 5 | 0.075 3 | ||
| 7月、9月 July vs. Sept. | 1 | - | - | 1 | - | - | ||
| B/T | 5月、7月 May vs. July | 1 | 0.385 0 | 0.535 0 | 1 | 2.435 1 | 0.118 6 | |
| 5月、9月 May vs. Sept. | 1 | 1.128 9 | 0.288 0 | 1 | 5.574 6 | 0.018 2 | ||
| 7月、9月 July vs. Sept. | 1 | 0.511 9 | 0.474 3 | 1 | 19.126 2 | 0.000 0 | ||
| Le/T | 5月、7月 May vs. July | 1 | 1.025 5 | 0.311 2 | 1 | 4.046 0 | 0.044 3 | |
| 5月、9月 May vs. Sept. | 1 | 4.351 1 | 0.037 0 | 1 | 6.291 6 | 0.012 1 | ||
| 7月、9月 July vs. Sept. | 1 | 3.208 5 | 0.073 3 | 1 | 22.295 6 | 0.000 0 | ||
| La/T | 5月、7月 May vs. July | 1 | 2.631 8 | 0.104 7 | 1 | 6.833 4 | 0.008 9 | |
| 5月、9月 May vs. Sept. | 1 | 0.196 0 | 0.658 0 | 1 | 0.580 5 | 0.446 1 | ||
| 7月、9月 July vs. Sept. | 1 | - | - | 1 | 4.070 1 | 0.043 6 | ||
表5 白刺不同物候期之间部分器官与整株标准化主轴回归截距的似然比检验
Table 5 Likelihood ratio test of the intercept of the Standardized-major-axis of biomass between organs and whole plant of Nitraria tangutorum in three phenological phases
| 器官 Organ | 时期 Time | 2016 | 2017 | |||||
|---|---|---|---|---|---|---|---|---|
| df | LR | p | df | LR | p | |||
| R/T | 5月、7月 May vs. July | 1 | 0.099 3 | 0.752 7 | 1 | - | - | |
| 5月、9月 May vs. Sept. | 1 | 3.502 9 | 0.061 3 | 1 | 1.326 6 | 0.249 4 | ||
| 7月、9月 July vs. Sept. | 1 | 7.672 1 | 0.005 6 | 1 | 0.056 8 | 0.811 7 | ||
| S/T | 5月、7月 May vs. July | 1 | 0.821 5 | 0.364 8 | 1 | - | - | |
| 5月、9月 May vs. Sept. | 1 | 3.533 1 | 0.060 2 | 1 | 3.162 5 | 0.075 3 | ||
| 7月、9月 July vs. Sept. | 1 | - | - | 1 | - | - | ||
| B/T | 5月、7月 May vs. July | 1 | 0.385 0 | 0.535 0 | 1 | 2.435 1 | 0.118 6 | |
| 5月、9月 May vs. Sept. | 1 | 1.128 9 | 0.288 0 | 1 | 5.574 6 | 0.018 2 | ||
| 7月、9月 July vs. Sept. | 1 | 0.511 9 | 0.474 3 | 1 | 19.126 2 | 0.000 0 | ||
| Le/T | 5月、7月 May vs. July | 1 | 1.025 5 | 0.311 2 | 1 | 4.046 0 | 0.044 3 | |
| 5月、9月 May vs. Sept. | 1 | 4.351 1 | 0.037 0 | 1 | 6.291 6 | 0.012 1 | ||
| 7月、9月 July vs. Sept. | 1 | 3.208 5 | 0.073 3 | 1 | 22.295 6 | 0.000 0 | ||
| La/T | 5月、7月 May vs. July | 1 | 2.631 8 | 0.104 7 | 1 | 6.833 4 | 0.008 9 | |
| 5月、9月 May vs. Sept. | 1 | 0.196 0 | 0.658 0 | 1 | 0.580 5 | 0.446 1 | ||
| 7月、9月 July vs. Sept. | 1 | - | - | 1 | 4.070 1 | 0.043 6 | ||
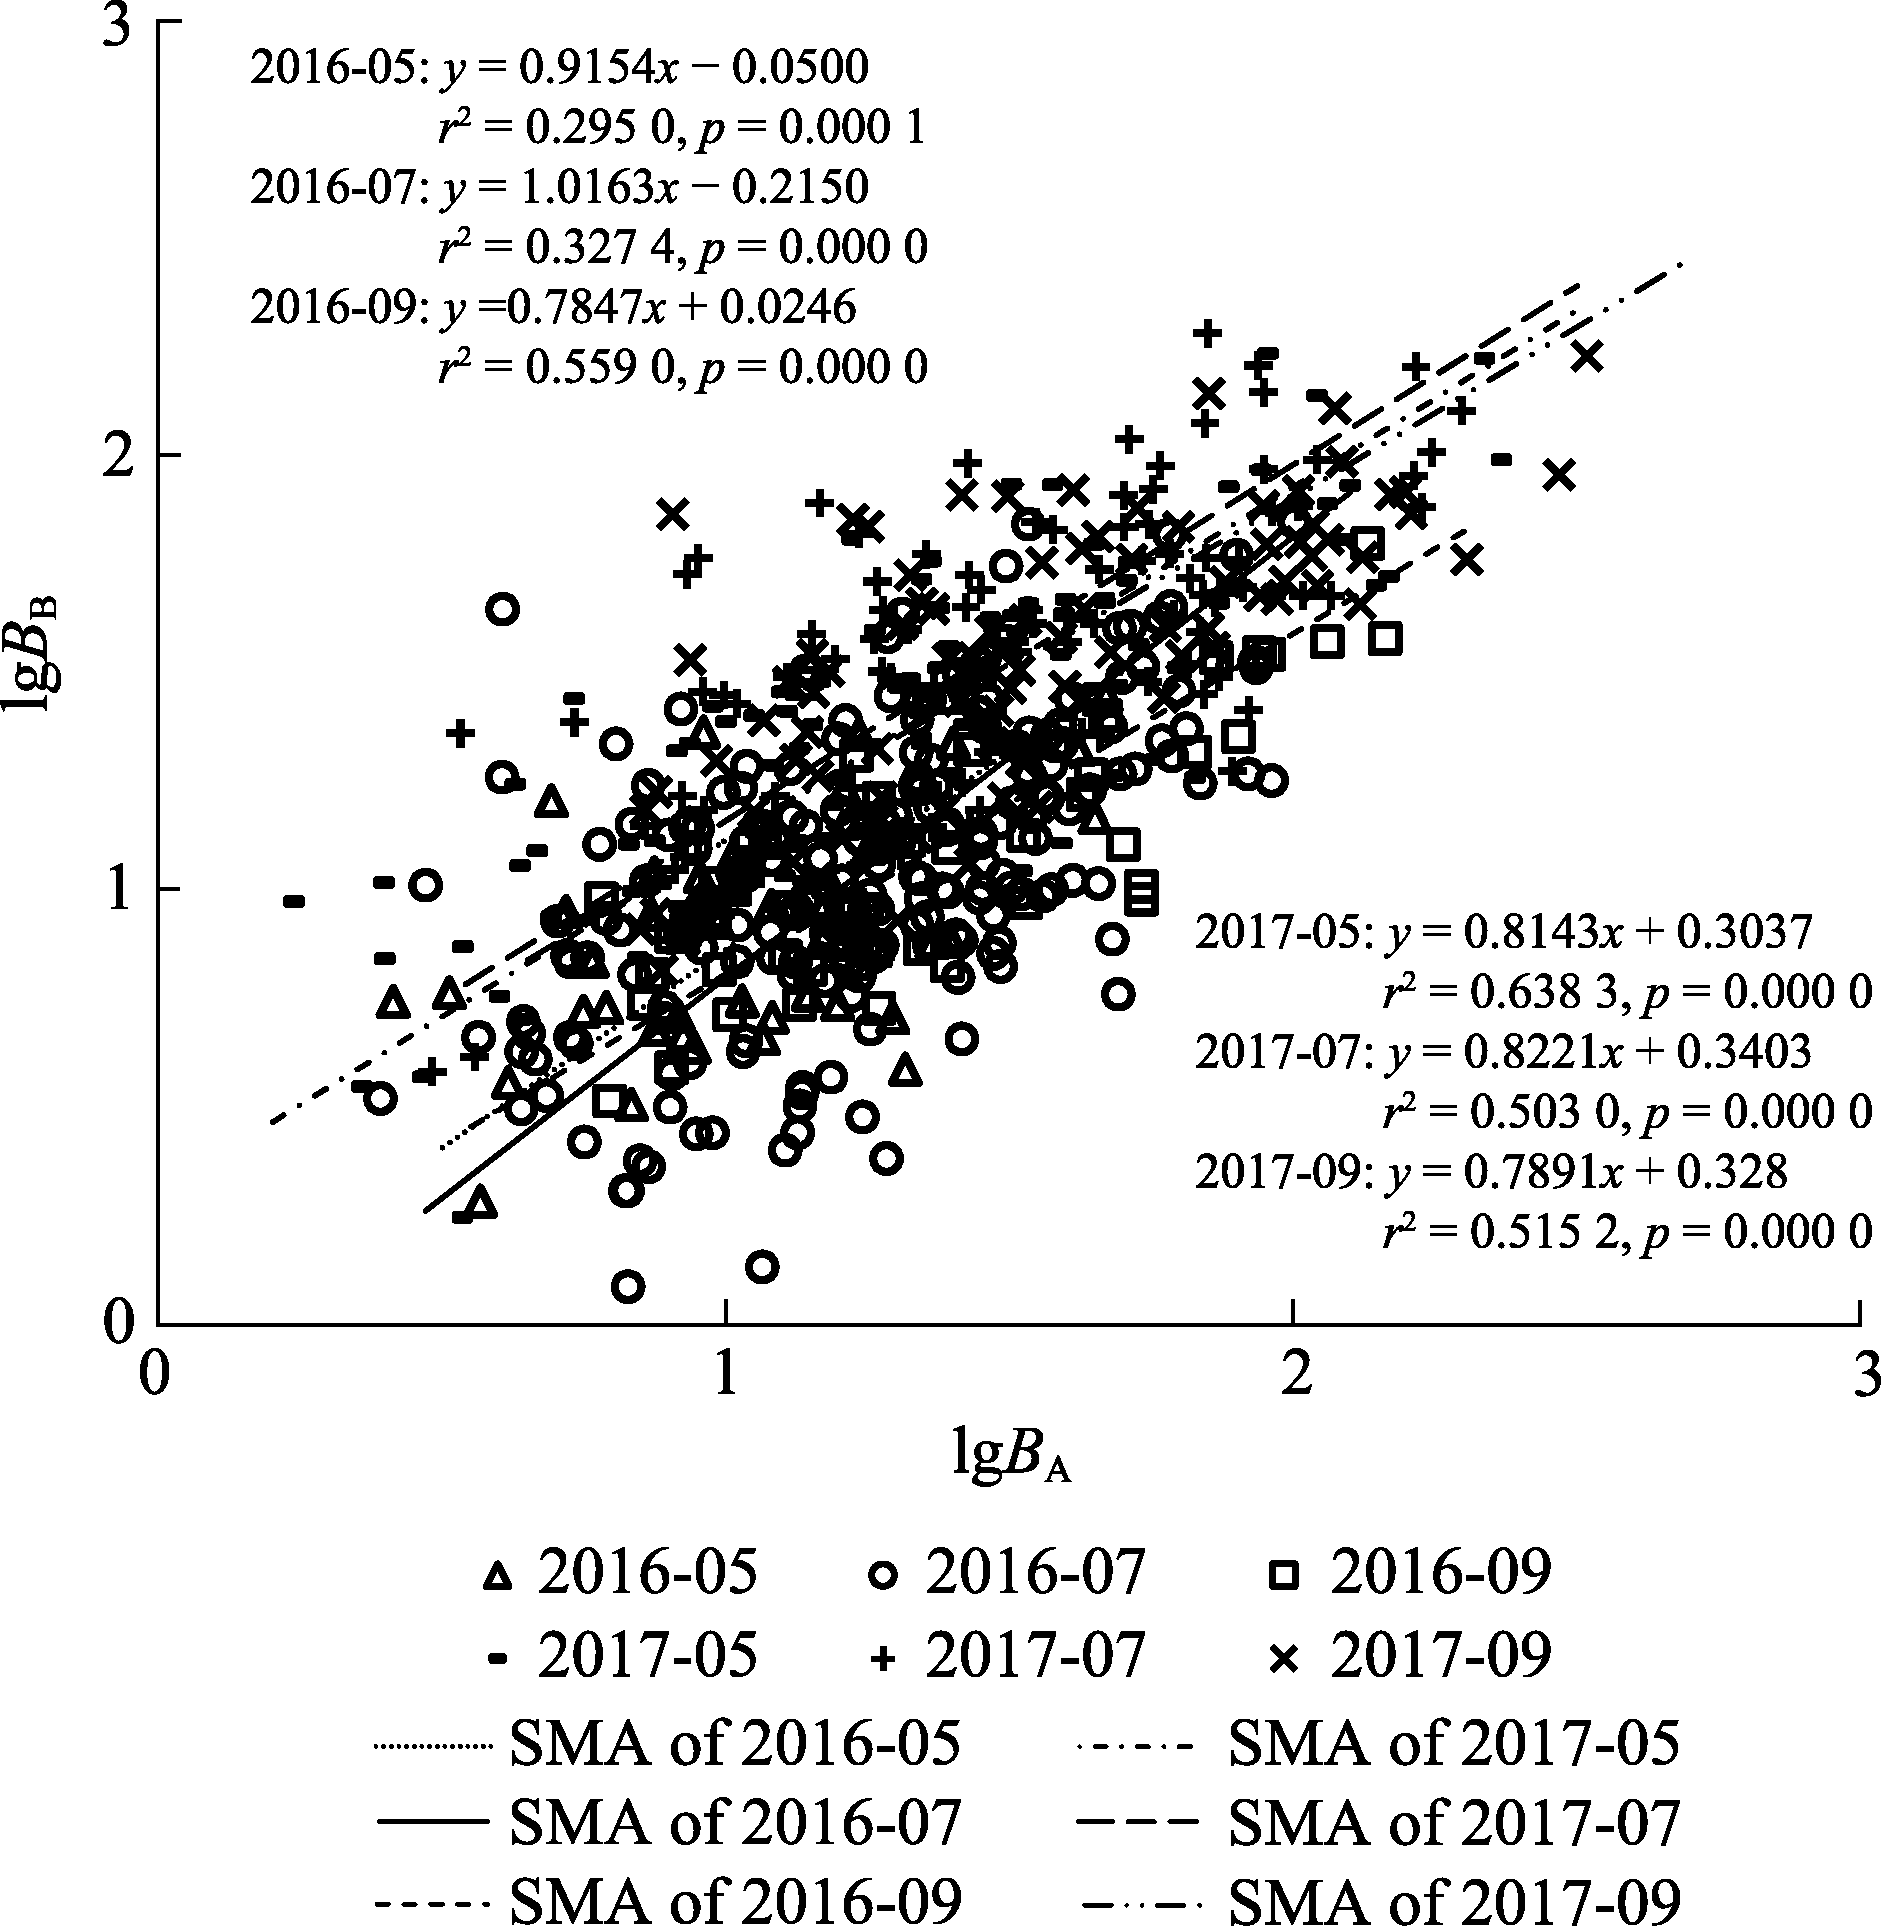
图1 白刺不同物候期地上部分与地下部分生物量的异速生长关系。 BA, 地上生物量; BB, 地下生物量。SMA, 标准化主轴回归。
Fig. 1 Allometric relationship between aboveground and belowground biomass in different phenological phases of Nitraria tangutorum. BA, aboveground biomass; BB, belowground biomass. SMA, standardized major axis regression.
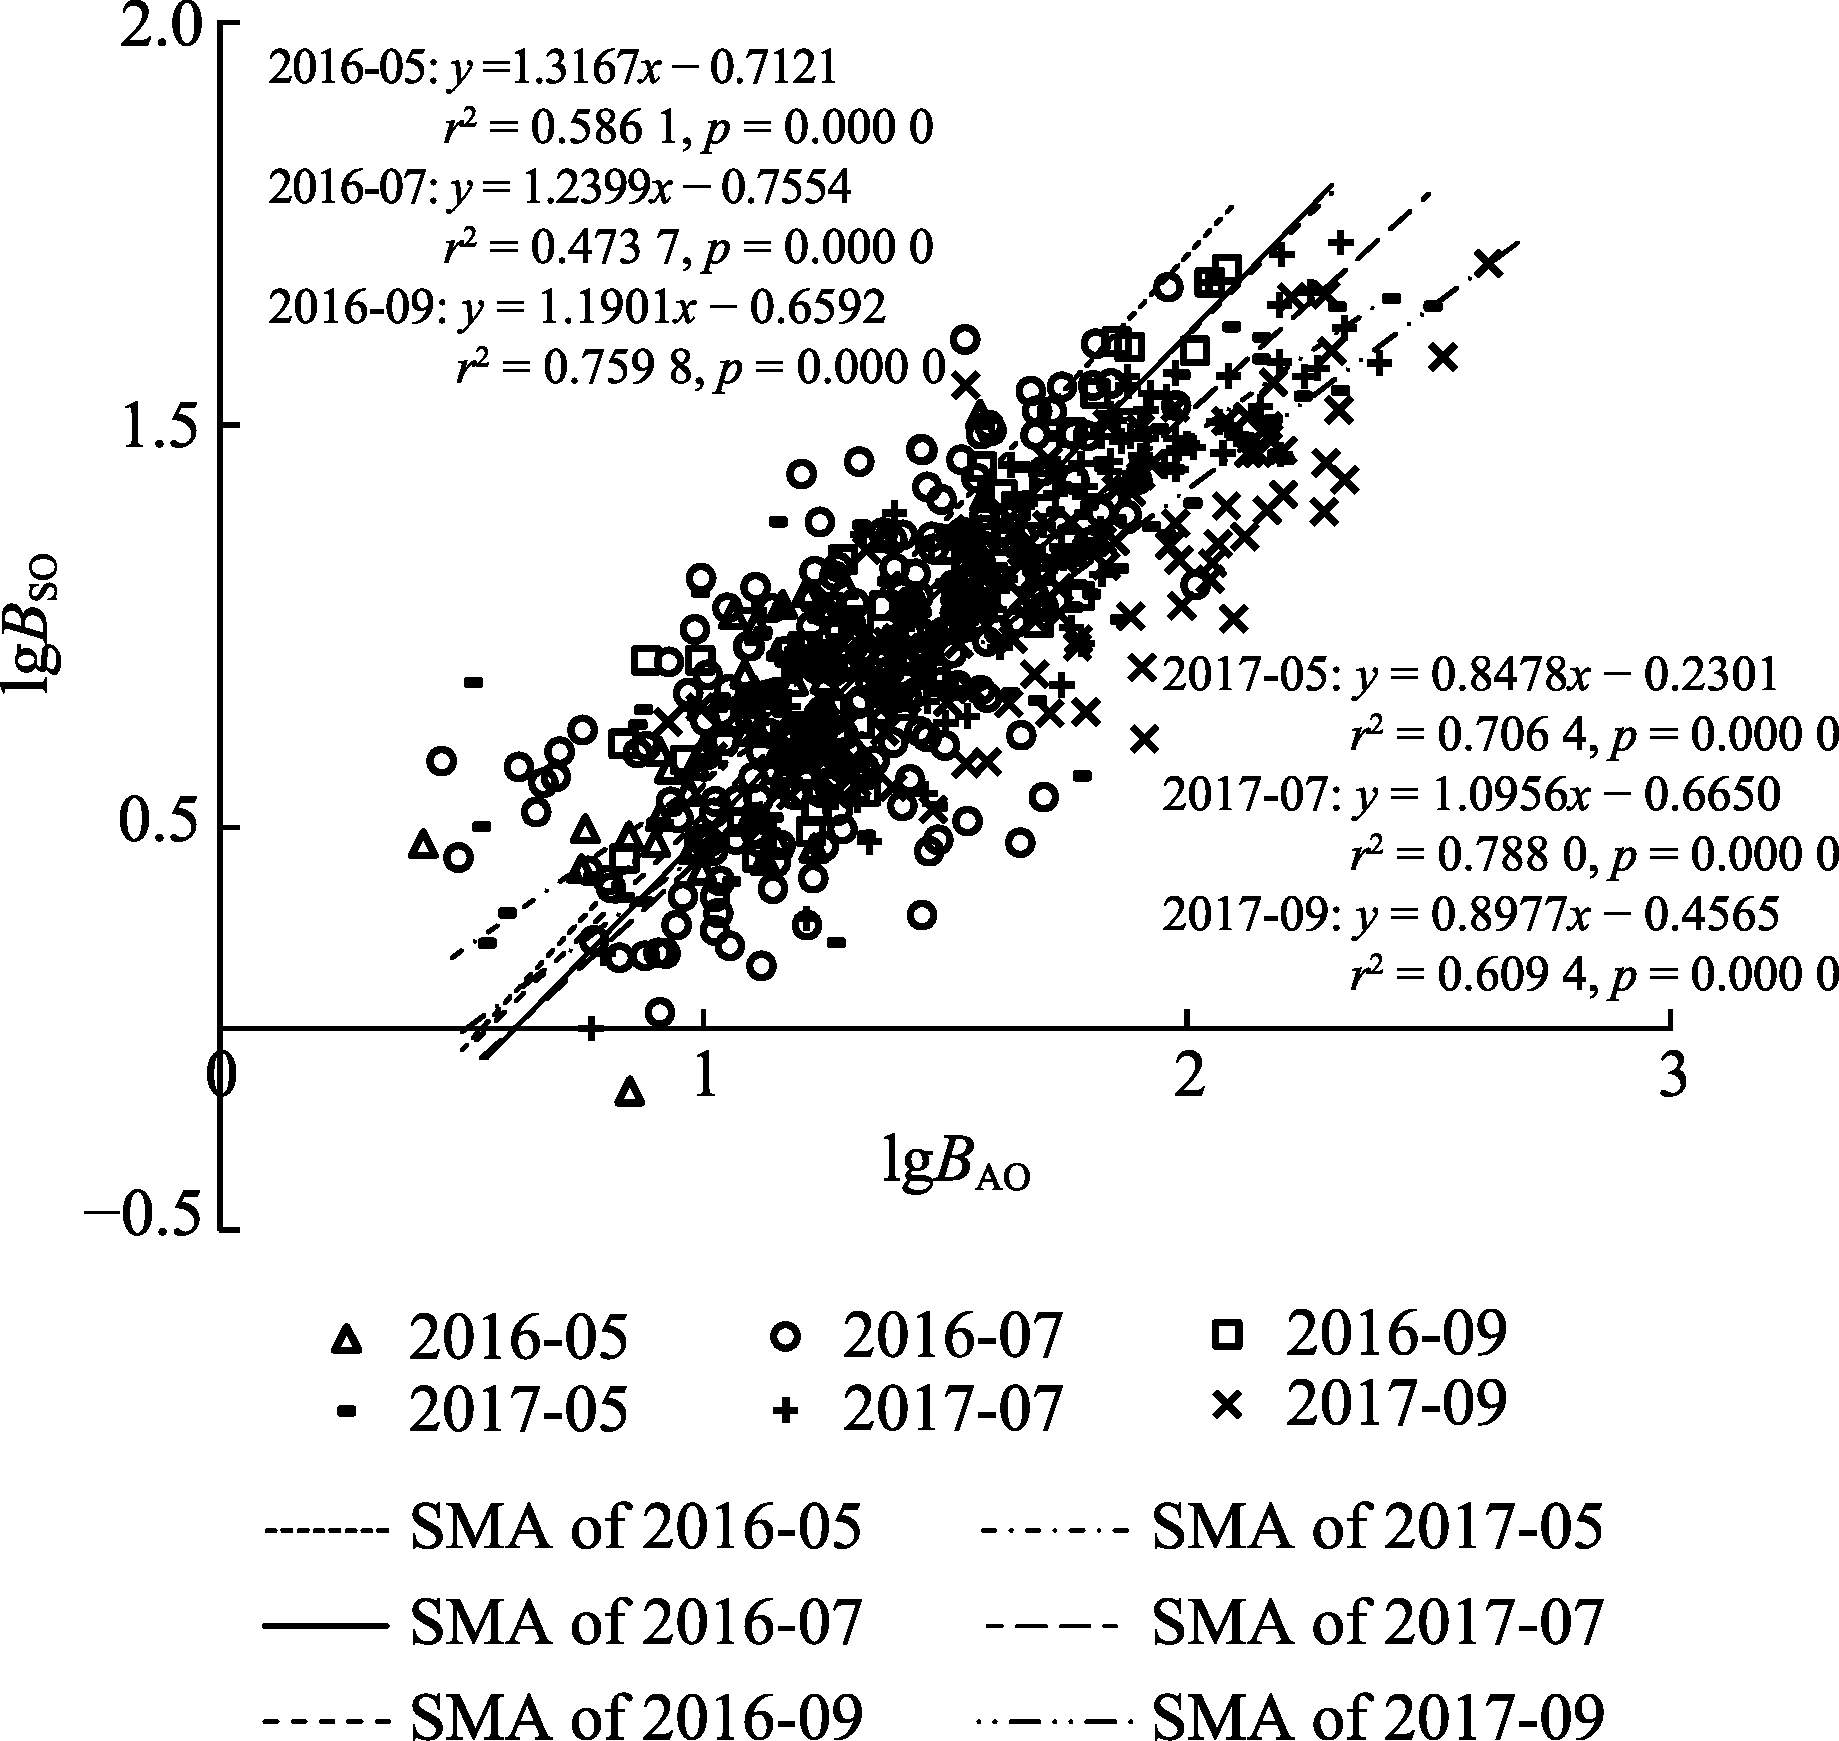
图2 白刺不同物候期支持器官与同化器官生物量的异速生长关系。 BAO, 同化器官生物量; BSO, 支持器官生物量。SMA, 标准化主轴回归。
Fig. 2 Allometric relationship between assimilating and supporting organs biomass in different phenological phases of Nitraria tangutorum. BAO, assimilating organs biomass; BSO, supporting organs biomass. SMA, standardized major axis regression.
| [1] |
Aarssen LW (2008). Death without sex—The ‘problem of the small’ and selection for reproductive economy in flowering plants. Evolutionary Ecology, 22, 279-298.
DOI URL |
| [2] | Barnes AD (2002). Effects of phenology, water availability and seed source on loblolly pine biomass partitioning and transpiration. Tree Physiology, 22, 733-740. |
| [3] |
Bond BJ (2000). Age-related changes in photosynthesis of woody plants. Trends in Plant Science, 5, 349-353.
URL PMID |
| [4] | Bonser SP, Aarssen LW (2009). Interpreting reproductive allometry: individual strategies of allocation explain size- dependent reproduction in plant populations. Perspectives in Plant Ecology, Evolution and Systematics, 11, 31-40. |
| [5] | Canham CD, Berkowitz AR, Kelly VR, Lovett GM, Ollinger SV, Schnurr J (1996). Biomass allocation and multiple resource limitation in tree seedlings. Canadian Journal of Forest Research, 26, 1521-1530. |
| [6] | Chen RF, Ran JZ, Huang H, Dong LW, Sun Y, Ji MF, Hu WG, Yao SR, Lu JL, Gong HY, Xie SB, Du QJ, Hou QQ, Niklas KJ, Deng JM (2019). Life history strategies drive size-dependent biomass allocation patterns of dryland ephemerals and shrubs. Ecosphere, 10, e02709. DOI: 10.1002/ecs2.2709. |
| [7] | Cheplick GP (2005). Biomass partitioning and reproductive allocation in the invasive, cleistogamous grass Microstegium vimineum: influence of the light environment. Journal of the Torrey Botanical Society, 132, 214-224. |
| [8] |
Cheverud JM (1982). Relationships among ontogenetic, static, and evolutionary allometry. American Journal of Physical Anthropology, 59, 139-149.
URL PMID |
| [9] |
Coleman MD, Friend AL, Kern CC (2004). Carbon allocation and nitrogen acquisition in a developing Populus deltoides plantation. Tree Physiology, 24, 1347-1357.
URL PMID |
| [10] | Deng JM, Wang GX, Morris EC, Wei XP, Li DX, Chen BM, Zhao CM, Liu J, Wang Y (2006). Plant mass-density relationship along a moisture gradient in north-west China. Journal of Ecology, 94, 953-958. |
| [11] | Eziz A, Yan ZB, Tian D, Han WX, Tang ZY, Fang JY (2017). Drought effect on plant biomass allocation: a meta- analysis. Ecology and Evolution, 7, 11002-11010. |
| [12] | Fan GH, Huang YX, Zhao XY, Shen XJ (2017). Effect of population density on the allometric growth of Agriophyllum squarrosum. Acta Prataculturae Sinica, 26, 53-64. |
| [ 范高华, 黄迎新, 赵学勇, 神祥金 (2017). 种群密度对沙米异速生长的影响. 草业学报, 26, 53-64.] | |
| [13] | Fraterrigo JM, Turner MG, Pearson SM (2006). Previous land use alters plant allocation and growth in forest herbs. Journal of Ecology, 94, 548-557. |
| [14] |
Fu YH, Zhao HF, Piao SL, Peaucelle M, Peng SS, Zhou GZ, Ciais P, Huang MT, Menzel A, Peñuelas J, Song Y, Vitasse Y, Zeng ZZ, Janssens IA (2015). Declining global warming effects on the phenology of spring leaf unfolding. Nature, 526, 104-107.
URL PMID |
| [15] | Gedroc JJ, McConnaughay KDM, Coleman JS (1996). Plasticity in root/shoot partitioning: optimal, ontogenetic, or both? Functional Ecology, 10, 44-50. |
| [16] | Guo LZ, Huang D, Zhang C, Li JH, Zhao H, Wang K (2019). Analysis of biomass allocation and allometric growth of Stellera chamaejasme in degraded typical steppe. Chinese Journal of Grassland, 41, 53-59. |
| [ 郭丽珠, 黄顶, 张丛, 李佳欢, 赵欢, 王堃 (2019). 退化典型草原狼毒生物量分配及异速生长分析. 中国草地学报, 41, 53-59.] | |
| [17] | Husáková I, Weiner J, Münzbergová Z (2018). Species traits and shoot-root biomass allocation in 20 dry-grassland species. Journal of Plant Ecology, 11, 273-285. |
| [18] | Klinkhamer PGL, Meelis E, de Jong TJ, Weiner J (1992). On the analysis of size-dependent reproductive output in plants. Functional Ecology, 6, 308-316. |
| [19] | Komiyama A, Ong JE, Poungparn S (2008). Allometry, biomass, and productivity of mangrove forests: a review. Aquatic Botany, 89, 128-137. |
| [20] | Li QH, Xin ZM, Gao TT, Wang SX, Xu J, Sun F (2012). Reproductive allocation in four desert species of the genus Nitraria L. Acta Ecologica Sinica, 32, 5054-5061. |
| [ 李清河, 辛智鸣, 高婷婷, 王赛宵, 徐军, 孙非 (2012). 荒漠植物白刺属4个物种的生殖分配比较. 生态学报, 32, 5054-5061.] | |
| [21] |
Menzel A, Sparks TH, Estrella N, Koch E, Aasa A, Ahas R, Alm-Kübler K, Bissolli P, Braslavská O, Briede A, Chmielewski FM, Crepinsek Z, Curnel Y, Dahl Å, Defila C, Donnelly A, Filella Y, Jatczak K, Måge F, Mestre A, Nordli Ø, Peñuelas J, Pirinen P, Remišová V, Scheifinger H, Striz M, Susnik A, van Vliet AJH, Wielgolaski FE, Zach S, Zust A (2006). European phenological response to climate change matches the warming pattern. Global Change Biology, 12, 1969-1976.
DOI URL |
| [22] | McCarthy MC, Enquist BJ (2007). Consistency between an allometric approach and optimal partitioning theory in global patterns of plant biomass allocation. Functional Ecology, 21, 713-720. |
| [23] | McConnaughay KDM, Coleman JS (1999). Biomass allocation in plants: ontogeny or optimality? A test along three resource gradients. Ecology, 80, 2581-2593. |
| [24] | Müller I, Schmid B, Weiner J (2000). The effect of nutrient availability on biomass allocation patterns in 27 species of herbaceous plants. Perspectives in Plant Ecology, Evolution and Systematics, 3, 115-127. |
| [25] | Niinemets U (2004). Adaptive adjustments to light in foliage and whole-plant characteristics depend on relative age in the perennial herb Leontodon hispidus. New Phytologist, 162, 683-696. |
| [26] |
Niklas KJ (2005). Modelling below- and above-ground biomass for non-woody and woody plants. Annals of Botany, 95, 315-321.
URL PMID |
| [27] |
Niklas KJ (2006). A phyletic perspective on the allometry of plant biomass-partitioning patterns and functionally equivalent organ-categories. New Phytologist, 171, 27-40.
URL PMID |
| [28] |
Niklas KJ, Enquist BJ (2002). On the vegetative biomass partitioning of seed plant leaves, stems, and roots. The American Naturalist, 159, 482-497.
URL PMID |
| [29] |
Peng YF, Yang YH (2016). Allometric biomass partitioning under nitrogen enrichment: evidence from manipulative experiments around the world. Scientific Reports, 6, 28918. DOI: 10.1038/srep28918.
URL PMID |
| [30] | Poorter H, Nagel O (2000). The role of biomass allocation in the growth response of plants to different levels of light, CO2, nutrients and water: a quantitative review. Australian Journal of Plant Physiology, 27, 595-607. |
| [31] |
Poorter H, Niklas KJ, Reich PB, Oleksyn J, Poot P, Mommer L (2012). Biomass allocation to leaves, stems and roots: meta-analyses of interspecific variation and environmental control. New Phytologist, 193, 30-50.
DOI URL PMID |
| [32] | Reekie EG, Bazzaz FA (2011). Reproductive Allocation in Plants. Academic Press, New York. 1-49. |
| [33] |
Reich PB, Luo YJ, Bradford JB, Poorter H, Perry CH, Oleksyn J (2014). Temperature drives global patterns in forest biomass distribution in leaves, stems, and roots. Proceedings of the National Academy of Sciences of the United States of America, 111, 13721-13726.
DOI URL PMID |
| [34] | Shipley B, Meziane D (2002). The balanced-growth hypothesis and the allometry of leaf and root biomass allocation. Functional Ecology, 16, 326-331. |
| [35] |
Tian DS, Pan QM, Simmons M, Chaolu HD, Du BH, Bai YF, Wang H, Han XG (2012). Hierarchical reproductive allocation and allometry within a perennial bunchgrass after 11 years of nutrient addition. PLOS ONE, 7, e42833. DOI: 10.1371/journal.pone.0042833.
URL PMID |
| [36] | Weiner J, Campbell LG, Pino J, Echarte L (2009). The allometry of reproduction within plant populations. Journal of Ecology, 97, 1220-1233. |
| [37] |
Wolkovich EM, Cook BI, Allen JM, Crimmins TM, Betancourt JL, Travers SE, Pau S, Regetz J, Davies TJ, Kraft NJB, Ault TR, Bolmgren K, Mazer SJ, McCabe GJ, McGill BJ, Parmesan C, Salamin N, Schwartz MD, Cleland EE (2012). Warming experiments underpredict plant phenollogical responses to climate change. Nature, 485, 494-497.
URL PMID |
| [38] |
Xie JB, Tang LS, Wang ZY, Xu GQ, Li Y (2012). Distinguishing the biomass allocation variance resulting from ontogenetic drift or acclimation to soil texture. PLOS ONE, 7, e41502. DOI: 10.1371/journal.pone.0041502.
URL PMID |
| [39] |
Xu H, Li Y, Xu GQ, Zou T (2007). Ecophysiological response and morphological adjustment of two Central Asian desert shrubs towards variation in summer precipitation. Plant, Cell & Environment, 30, 399-409.
URL PMID |
| [1] | 陈文义, 王智勇, 周梦岩, 麻文俊, 王军辉, 罗志斌, 周婧. 幼龄楸树生物量分配规律与异速生长模型[J]. 植物生态学报, 2025, 49(2): 356-366. |
| [2] | 张富崇, 于明含, 张建玲, 王平, 丁国栋, 何莹莹, 孙慧媛. 黑沙蒿应对降水变化的木质部与韧皮部协同响应机制[J]. 植物生态学报, 2024, 48(7): 903-914. |
| [3] | 梁逸娴, 王传宽, 臧妙涵, 上官虹玉, 刘逸潇, 全先奎. 落叶松径向生长和生物量分配对气候变暖的响应[J]. 植物生态学报, 2024, 48(4): 459-468. |
| [4] | 耿雪琪, 唐亚坤, 王丽娜, 邓旭, 张泽凌, 周莹. 氮添加增加中国陆生植物生物量并降低其氮利用效率[J]. 植物生态学报, 2024, 48(2): 147-157. |
| [5] | 陶琼, 缪宁, 岳喜明, 罗建琼, 薛盼盼, 王晖. 川西亚高山岷江冷杉幼苗生物量积累与分配的影响因子[J]. 植物生态学报, 2024, 48(11): 1459-1470. |
| [6] | 李兆光, 文高, 和桂青, 徐天才, 和琼姬, 侯志江, 李燕, 薛润光. 滇西北藜麦氮磷钾生态化学计量特征的物候期动态[J]. 植物生态学报, 2023, 47(5): 724-732. |
| [7] | 刘艳杰, 刘玉龙, 王传宽, 王兴昌. 东北温带森林5个羽状复叶树种叶成本-效益关系比较[J]. 植物生态学报, 2023, 47(11): 1540-1550. |
| [8] | 王广亚, 陈柄华, 黄雨晨, 金光泽, 刘志理. 着生位置对水曲柳小叶性状变异及性状间相关性的影响[J]. 植物生态学报, 2022, 46(6): 712-721. |
| [9] | 李露, 金光泽, 刘志理. 阔叶红松林3种阔叶树种柄叶性状变异与相关性[J]. 植物生态学报, 2022, 46(6): 687-699. |
| [10] | 熊映杰, 于果, 魏凯璐, 彭娟, 耿鸿儒, 杨冬梅, 彭国全. 天童山阔叶木本植物叶片大小与叶脉密度及单位叶脉长度细胞壁干质量的关系[J]. 植物生态学报, 2022, 46(2): 136-147. |
| [11] | 董楠, 唐明明, 崔文倩, 岳梦瑶, 刘洁, 黄玉杰. 不同根系分隔方式对栗和茶幼苗生长的影响[J]. 植物生态学报, 2022, 46(1): 62-73. |
| [12] | 尹晓雷, 刘旭阳, 金强, 李先德, 林少颖, 阳祥, 王维奇, 张永勋. 不同管理模式对茶树碳氮磷含量及其生态化学计量比的影响[J]. 植物生态学报, 2021, 45(7): 749-759. |
| [13] | 杨克彤, 常海龙, 陈国鹏, 俞筱押, 鲜骏仁. 兰州市主要绿化植物气孔性状特征[J]. 植物生态学报, 2021, 45(2): 187-196. |
| [14] | 王娇, 关欣, 张伟东, 黄苛, 朱睦楠, 杨庆朋. 杉木幼苗生物量分配格局对氮添加的响应[J]. 植物生态学报, 2021, 45(11): 1231-1240. |
| [15] | 熊星烁, 蔡宏宇, 李耀琪, 马文红, 牛克昌, 陈迪马, 刘娜娜, 苏香燕, 景鹤影, 冯晓娟, 曾辉, 王志恒. 内蒙古典型草原植物叶片碳氮磷化学计量特征的季节动态[J]. 植物生态学报, 2020, 44(11): 1138-1153. |
| 阅读次数 | ||||||
|
全文 |
|
|||||
|
摘要 |
|
|||||
Copyright © 2026 版权所有 《植物生态学报》编辑部
地址: 北京香山南辛村20号, 邮编: 100093
Tel.: 010-62836134, 62836138; Fax: 010-82599431; E-mail: apes@ibcas.ac.cn, cjpe@ibcas.ac.cn
备案号: 京ICP备16067583号-19
![]()